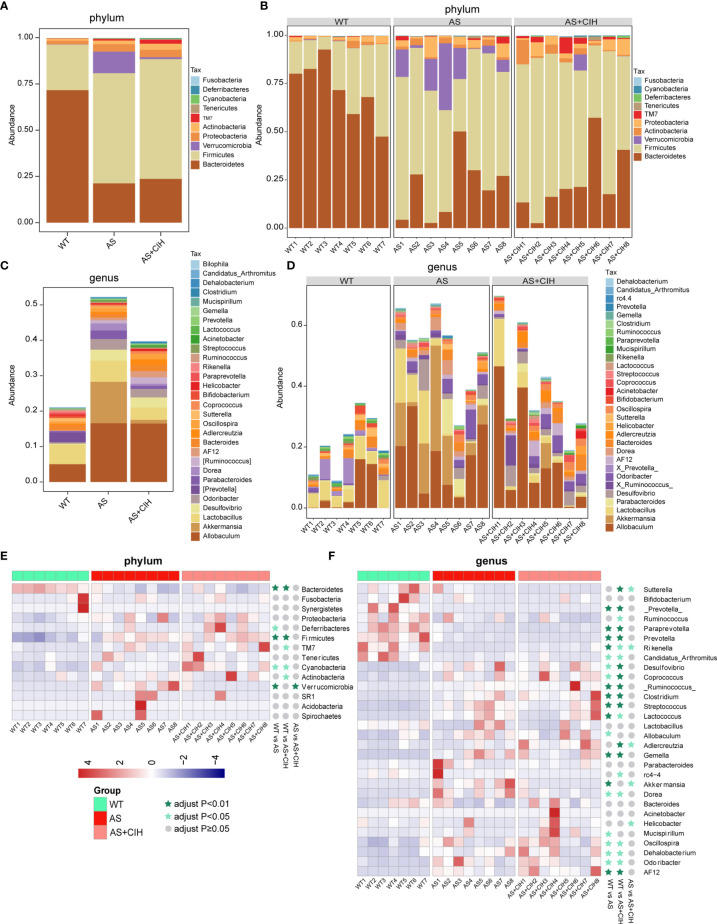
Figure 3.
Gut taxonomic profiling of bacterial communities following CIH induction. (A–C) The bar plots indicate the mean relative abundance of top 10 phyla (A) and the top 30 genera (C) annotated in WT, AS and AS+CIH groups, where phyla and genera are differentiated by color. (B, D) Bar plots of the relative abundance of the top 10 phyla (B) and top 30 genera (D) annotated in each sample from WT, AS and AS+CIH. Phyla and genera are differentiated by color. (E, F) Heat map showing the top 14 (E) and top 30 (F) dominant bacteria annotated at the phyla and genus level respectively. The relative abundances are expressed by Z scores by subtracting the average abundance and dividing the standard deviation of all samples. Z scores are represented by blue color when the row abundance is lower than the mean and with red when the row abundance is higher than the mean. The taxon at P value <0.01 is marked with dark green star, whereas when the P value <0.05 the taxon is marked with light green star, and when the P value ≥0.05 with gray circle. n=7 for WT, and n=8 for AS and AS+CIH.

