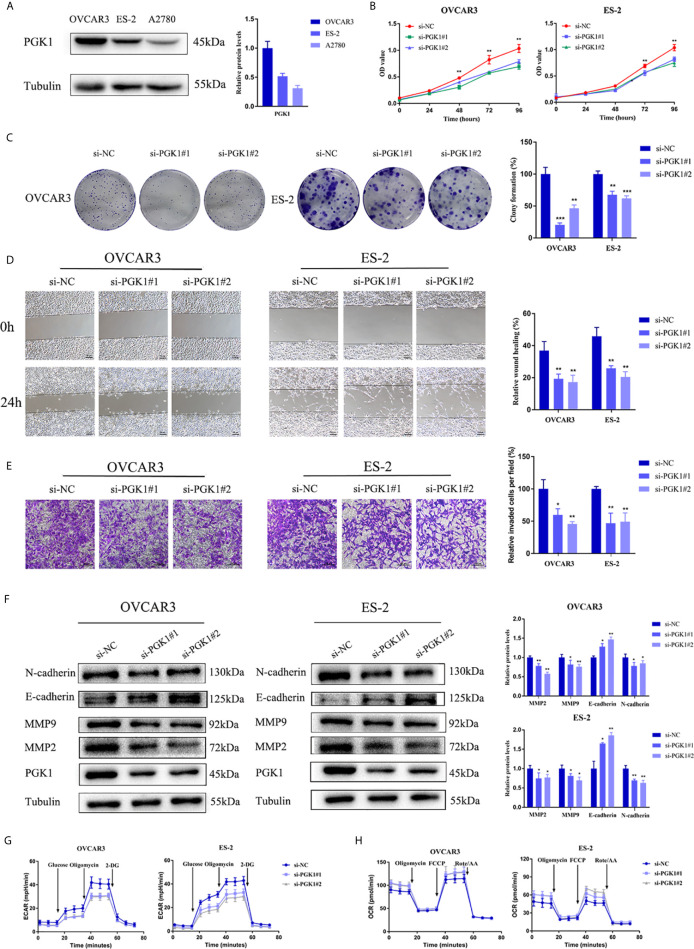
Figure 8.
PGK1 affected EMT process and glycolysis of ovarian cancer cells. (A) PGK1 protein expression in three kinds of ovarian cancer cell lines. (B) PGK1-siRNA inhibited the proliferation of ovarian cancer cells. (C) PGK1-siRNA reduced the formation of colonies of ovarian cancer cells. (D) PGK1-siRNA reduced the migration of ovarian cancer cells. (E) PGK1-siRNA reduced the invasion of ovarian cancer cells. (F) PGK1-siRNA decreased the protein expression levels of MMP2, MMP9, and N-cadherin but increased the protein expression level of E-cadherin. (G) Chart of ECAR measurement in PGK1-silenced cells. (H) Chart of OCR measurement in PGK1-silenced cells. Error bars represent the mean ± SD of three independent experiments. *P < 0.05; **P < 0.01; ***P < 0.001.

