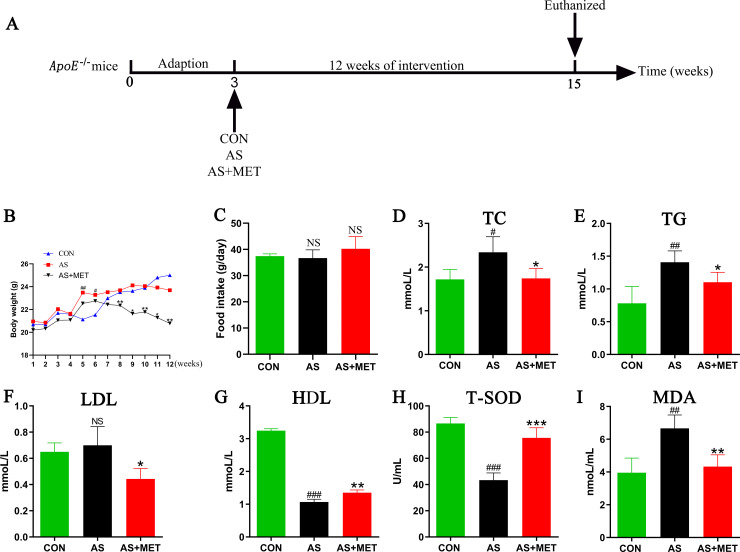
Fig 1. Effects of oral MET intervention on the parameters in AS.
(A) Schematic diagram of the study. After 3 weeks of adaption feeding, ApoE-/- mice with 18-20g were randomly assigned into 3 groups: control group (CON), atherosclerosis group (AS) and AS treated with metformin (MET) group (AS+MET). After 12 weeks of intervention, all of the mice were sacrificed and related indicators were investigated; (B) Body weights (BWs) dynamic curve; (C) BWs at the end of the experiment; (D) Total cholesterol (TC); (E) Triglyceride (TG); (F) High-density lipoprotein (HDL); (G) Low-density lipoprotein (LDL); (H) Total superoxide dismutase(T-SOD); (I) Malondialdehyde (MDA). Results were from 4 independent experiments were performed in triplicate. Data were presented as mean ± SEM. #(CON vs. AS): #p<0.05, ##p< 0.01, ###p< 0.001. *(AS vs. AS+MET): *p<0.05, **p<0.01, ***p<0.001. NS, no significant difference.

