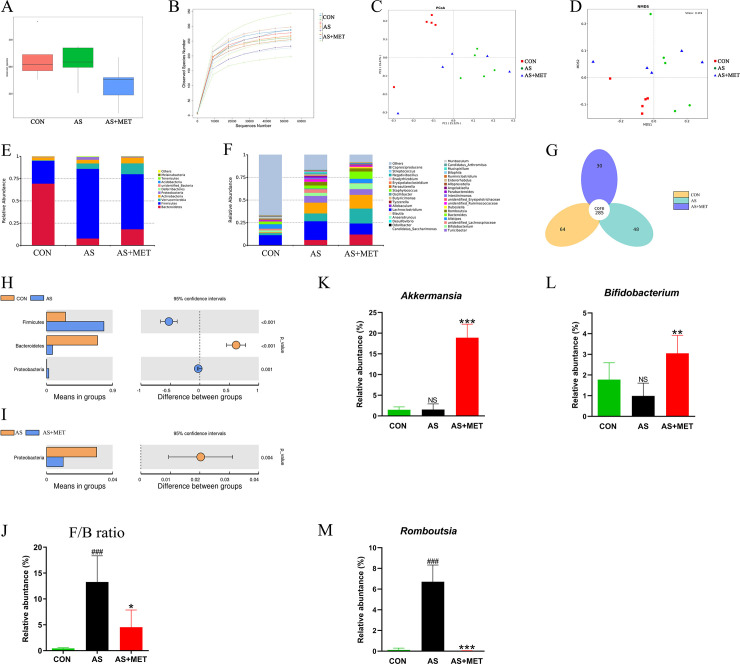
Fig 5. Gut microbial community in fecal samples of different groups.
(A) Observed-species index; (B) Rarefaction Curve; (C) PCoA analysis; (D) NDMS analysis; (E, H, I, J) The phylum level; (F, K, L, M) The genus level; (G) Venn diagram. #(CON vs. AS): #p<0.05, ##p< 0.01, ###p< 0.001. *(AS vs. AS+MET): *p<0.05, **p<0.01, ***p<0.001. NS, no significant difference.

