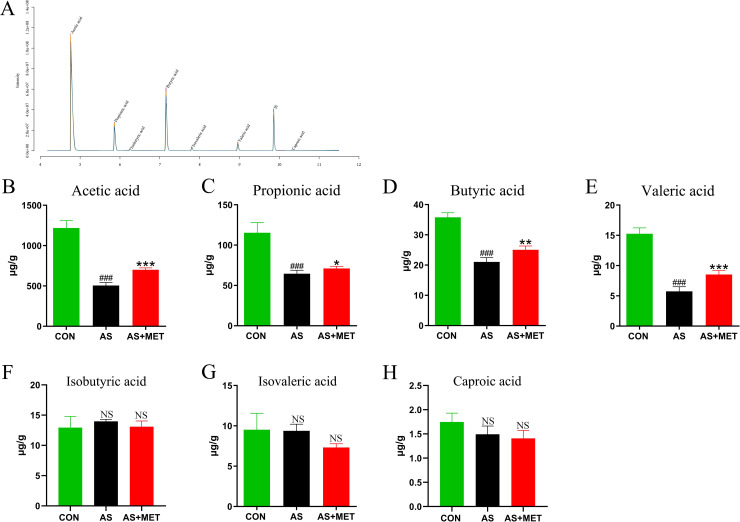
Fig 6. Measurement of the contents of SCFAs in different groups.
Chromatogram of mice stool (A). Determination of levels (μg/g) of Acetic acid (B); Propionic acid (C); Butyric acid (D); Valeric acid (E); Isobutyric acid (F); Isovaleric acid (G) and Caproic acid (H) by gas chromatography-mass spectrometer (GC-MS). #(CON vs. AS): #p<0.05, ##p< 0.01, ###p< 0.001. *(AS vs. AS+MET): *p<0.05, **p<0.01, ***p<0.001. NS, no significant difference.

