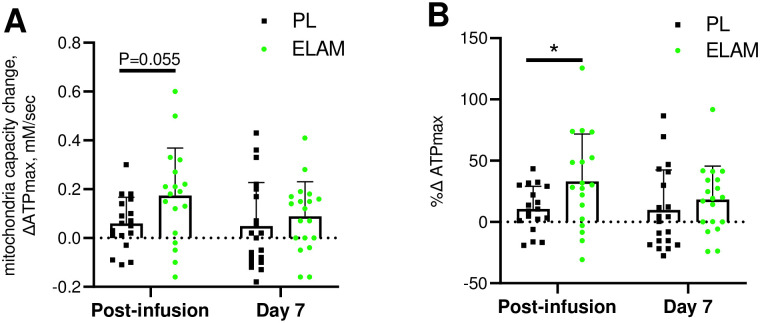
Fig 2. Change in mitochondrial energetic capacity (ΔATPmax) with ELAM treatment.
Change from baseline with ELAM treatment (post-infusion) and from baseline 7 days post-infusion (day 7). A) Absolute change in ATPmax; B) % change relative to baseline value. Error bars show SD. ELAM = elamipretide; PL = placebo.

