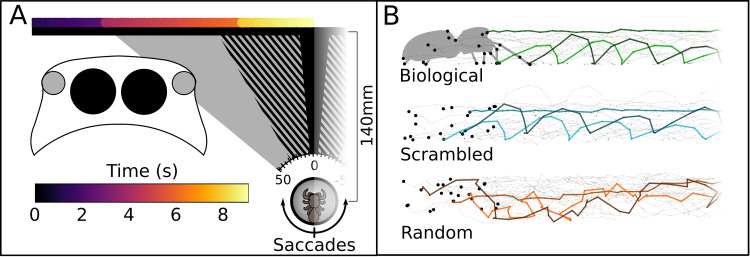
Fig 1. Stimuli movement across the screen and of each point.
(A) Schematic representation of the setup, left half. The black horizontal line represents the computer screen. The colored line above represents the position of the stimulus across time (color scale). Note the sudden color changes where the stimulus paused for 1.5 seconds before starting to move again. Once at the center, the stimulus disappeared behind a white box. To turn toward any stimulus on the screen, the spider can produce saccades, by pivoting around its vertical axis (z-axis of the sphere). Cones drawn toward the screen: visual field of the different eyes. In black, the visual field of the AME. The striped area represents the extended visual field of the AME when moved. In gray, the visual field of the ALE. Note that the visual field of the remaining eyes covers all the rest of the screen. Large overlay schematic on left depicts a jumping spider cephalothorax, seen frontally with the AME in black, and the ALE in gray. (B) Point-light displays. On the left, the full set of dots for the first frame. For the biological, the silhouette has been superimposed on the dots, to show how they correlate with the spider’s joints. For each stimulus, the paths for 3 points (the same 3 in all displays) is highlighted. Note how for the scrambled display, while the position of the points is different from the biological, the path that they follow is identical. ALE, anterior lateral eyes; AME, anterior medial eyes.

