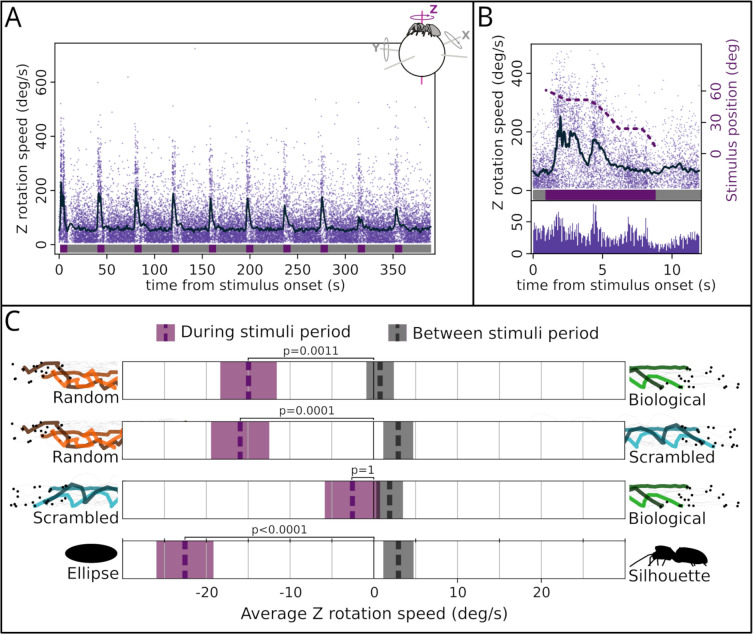
Fig 2. Results.
(A) Recorded peak rotation speeds for each trial (every set of 10 stimuli pair presentations; ntrials = 188; nspiders = 60). The x-axis represents time (in seconds) from the start of the experiment, and the y-axis represents rotational speed (in degrees per second). Individual dots represent peaks, while the dark line shows the running average. In the top-right corner, a schematic representation of the spider on top of the sphere, with the 3 possible axis of rotation. The data presented in this and the following graphs refer to rotation observed on the sphere’s z-axis, which correspond to the spider’s saccades. Below, colors show when the stimuli were onscreen (purple) or not present (gray). When stimuli are present, the average rotational speed increases, while when stimuli are not present, peak rotational speed remains low. This suggests that rotational speed is representative of saccades and that spiders are turning toward stimuli (see Materials and methods section). (B) Time-aligned responses across all stimuli. Upper portion: same as panel A, with addition of right y-axis indicating position of the stimuli on the screen (in degrees from the center, dashed purple line). Below portion: histogram of the peaks frequency. Peak frequency increases when the stimuli are moving and decreases when they are stationary (flat sections of the stimulus position line). (C) Stimulus preference for each condition. The x-axis represents the rotational speed. Positive or negative values correspond to a preference for the stimulus indicated. Purple boxes refer to sections when the stimuli were visible (during stimuli period), and gray boxes refer to sections when stimuli were not visible (between stimuli period). Dashed lines in the box represent the average, and shaded areas represent SE. For this analysis, every peak was either positive, when turning toward the stimulus depicted on the right of the graph (the one with biological characteristics), or negative, when turning toward the stimulus shown on the left. Thus, average speed is a proxy of relative preference, with 0 corresponding to no preference. For the biological versus random, scrambled versus random, and silhouette versus ellipse, the spiders preferred the less realistic stimulus. We observed no preference in the biological versus scrambled condition. Across all conditions, there was no preference during the 30-second between-stimuli period. Data underlying panels A and B are available in S1 Data. Panel C depicts result of the GLMM based on the same data. The analysis script is available in S2 Analysis. GLMM, generalized linear mixed model; SE, standard error.

