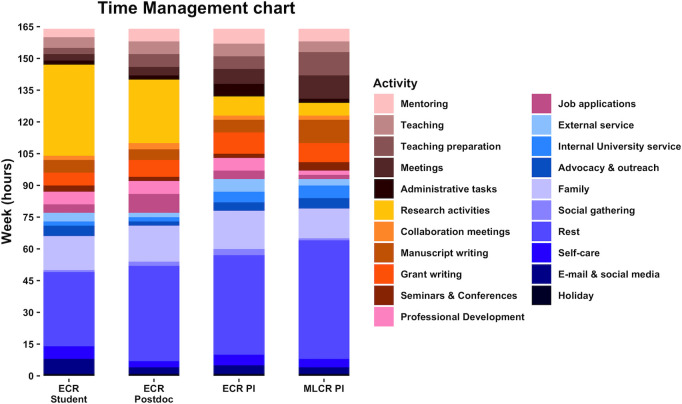
Fig 1. Time management charts to help monitor workload and prioritize activities.
Dynamic, prospective, or retrospective weekly or monthly time management assessment charts can help researchers with improving their work–life balance by determining exactly how they spend their time. There are 164 hours in a week. Example hour allocation is shown here for academics across career stages [50]. Hours allocated will vary depending on the researcher’s disciplines (for instance, humanities versus life sciences or engineering) and circumstances such as end or beginning of semester, when approaching a deadline, or when a committee is busiest. Teaching responsibilities include course instruction and administration, including grading and evaluation. Family time includes interacting, dining, and performing housekeeping chores with family members. Research activities include performing research and literature review time. External service may include manuscript or grant reviewing and editorial tasks. Meetings may include lab/group meetings, departmental faculty meetings, or other council meetings. Self-care activities may include attending to one’s hobbies. Internal service includes department and university service. Weekends and public holidays are included in the weeks. Other tasks not included in this chart may be professional development, writing letters of recommendation, advising undergraduate students, faculty and student hiring/recruitment, marketing/public relations, fundraising, phone calls, reception/dinner, commute/travel, scheduling/planning, and reporting. ECR, early career researcher; MLCR, mid- to later career researcher; PI, principal investigator. Figure created using ggplot library in R [51].

