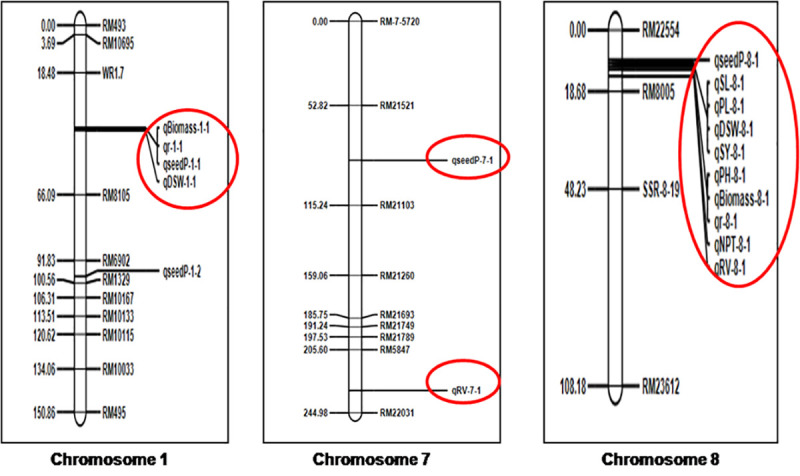
Fig 3. Linkage map and the position of identified QTLs for low soil P tolerance.

qPH- Plant height, qSL- Shoot length, qNPT- Number of productive tillers, qPL- Panicle length, DSW- Dry shoot weight, RV- Root volume, qSY- Yield per plant, qBiomass- Total biomass, qseedP- Phosphorus content of seed. Major QTL hot-spots were noticed on Chr. 1 and Chr. 8.
