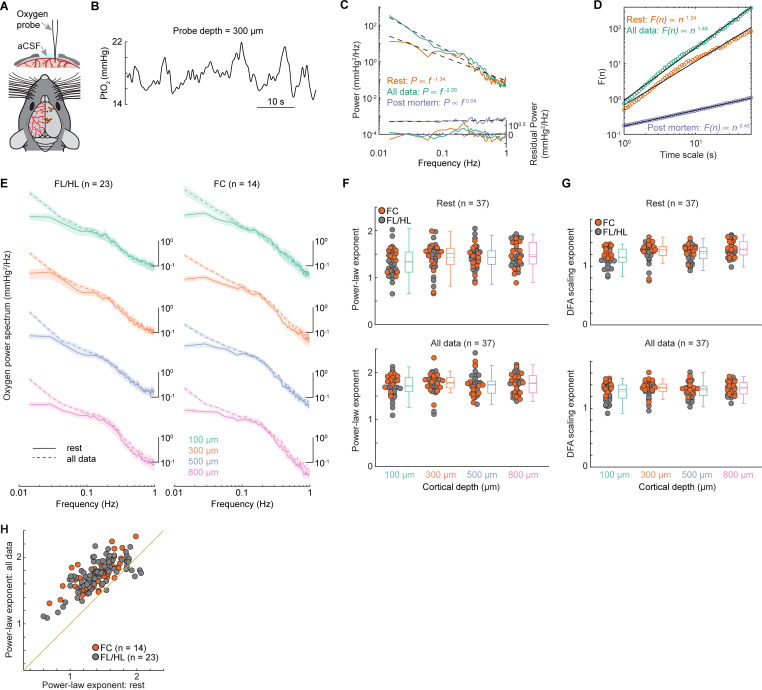
Fig 1. 1/f-like dynamics of brain tissue oxygenation.
(A) Experimental setup (top) and a summary of measurement sites (bottom). (B) Example trace showing the spontaneous fluctuations of tissue oxygenation (PtO2) 300 μm below the pia. (C) Representative power spectrum of the PtO2 (solid line) as well as its power law fit (dashed line) using data from resting period (orange) and periods including both rest and locomotion (green). The residual power (i.e., the difference between the power spectrum of the observed oxygen signal and the power law fit) is shown in the bottom. The purple trace indicates the power spectrum of PtO2 and its linear regression fit from a mouse postmortem. The power law exponent (−0.04) of the linear regression fit is reduced to near white noise. (D) Example showing the DFA scaling from the same datasets in (C). (E) Group average of PtO2 power spectrum during periods of rest (solid line) and periods including both rest and locomotion (dashed line) across different cortical depths in both FL/HL (n = 23 mice) and FC (n = 14 mice). Data are shown as mean ± SEM. For better visualization and comparison between these signals, the power spectrum curves have been vertically shifted between different cortical depths. (F) Group average (n = 37 mice) of power-law exponent across different cortical layers during periods of rest (top) and periods including both rest and locomotion (bottom). Gray circles denote the measurements in FL/HL (n = 23 mice), while the orange circles denote the measurements in FC (n = 14 mice). (G) As (F) but for DFA scaling exponents. (H) Scatter plot showing the increase of power-law exponent during periods including locomotion. The orange line indicates the unity line. Data in (F) and (G) are shown as median ± interquartile range using boxplot, with the sample mean shown as dashed lines. The data used to generate this figure are available at https://doi.org/10.5061/dryad.pg4f4qrmt. DFA, detrended fluctuation analysis; FC, frontal cortex; FL/HL, forelimb/hindlimb.

