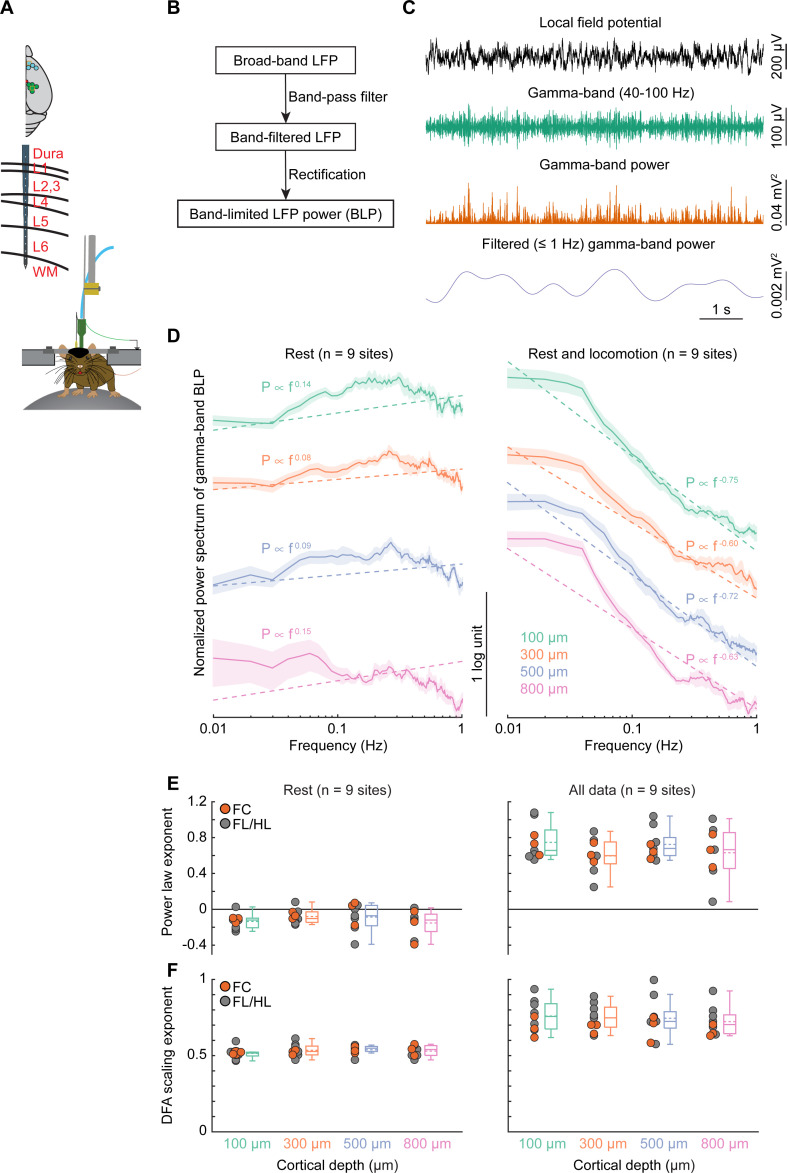
Fig 2. 1/f-like dynamics of BLP signals for gamma-band.
(A) Experimental setup. Top, schematic showing all laminar electrophysiology measurement sites in FC (n = 4 sites) and FL/HL (n = 6 sites). Bottom, schematic showing the layout of the electrodes and measurement depth. (B) Schematic outline the general method for extracting the BLP signals. Raw LFP data were first bandpass filtered and then rectified. The resulting signal was then low-pass filtered and resampled. This procedure was applied to each frequency band of the LFP. (C) Example traces showing the application of this scheme to one LFP signal, for the gamma-band frequency range. (D) Normalized (by total power between 0.01–1 Hz) power spectrum of gamma-band LFP power across cortical depth during rest (left) and periods including rest and locomotion (right). The dashed lines denote the group average linear regression fit. Data are shown as mean ± SEM. For better visualization and comparison between these signals, the power spectrum curves have been vertically shifted between different cortical depths. (E) Group average of power law exponent across different cortical layers during periods of rest (left, n = 9 sites) and periods including both rest and locomotion (right, n = 9 sites). Gray circles denote the measurements in FL/HL, while the orange circles denote the measurements in FC. (F) As (E) but for DFA scaling exponents. Data in (E) and (F) are shown as median ± interquartile range using boxplot, with the sample mean shown as dashed lines. The data used to generate this figure are available at https://doi.org/10.5061/dryad.pg4f4qrmt. BLP, band-limited power; DFA, detrended fluctuation analysis; FC, frontal cortex; FL/HL, forelimb/hindlimb; LFP, local field potential.

