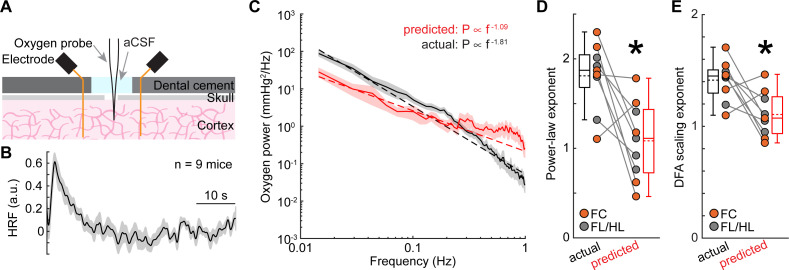
Fig 4. Nonneuronal factors contribute to the 1/f-like dynamics of tissue oxygenation.
(A) Experimental setup. (B) Group average (n = 9 mice) of the HRF obtained by deconvolving brain tissue oxygenation by gamma-band power of the LFP. (C) Power spectrum of actual (black) and predicted (red) oxygenation. (D) Power law exponent of actual (black) and predicted (red) oxygenation in FL/HL (4 mice, gray circle) and FC (5 mice, orange circle). *paired t test, t(8) = 3.4059, p = 0.0093. (E) As (D) but for scaling exponent from DFA. *paired t test, t(8) = 2.8085, p = 0.0229. Data are shown as mean ± SEM in (B) and (C). Data in (D) and (E) are shown as median ± interquartile range using boxplot, with the sample mean shown as dashed lines. The data used to generate this figure are available at https://doi.org/10.5061/dryad.pg4f4qrmt. aCSF, artificial cerebrospinal fluid; DFA, detrended fluctuation analysis; FC, frontal cortex; FL/HL, forelimb/hindlimb; HRF, hemodynamic response function; LFP, local field potential.

