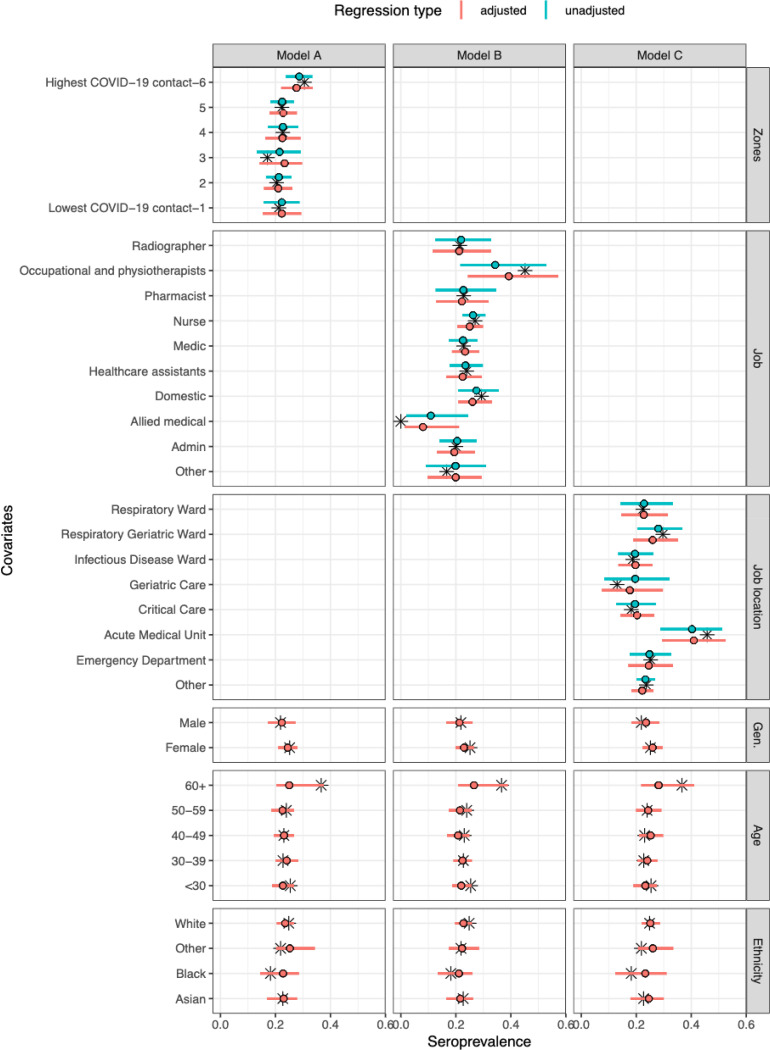
Figure 1. Model-predicted seroprevalence estimates for three different models (A-C), adjusted and unadjusted with covariates gender, age group, and ethnicity.
Black stars represent point values from the data. The point and whiskers represent the mean value and 95% CrI of the posterior distribution. The three models differed by their primary exposure, Model A used COVID-19 zones (defined in supplementary information, 1 refers to lowest COVID-19 contact and 6 refers to highest COVID-19 contact), Model B the job role, and Model C the job location. Each model was evaluated either unadjusted (primary exposure only) or adjusted (primary exposure with age, gender, and ethnicity).

