Figure 3:

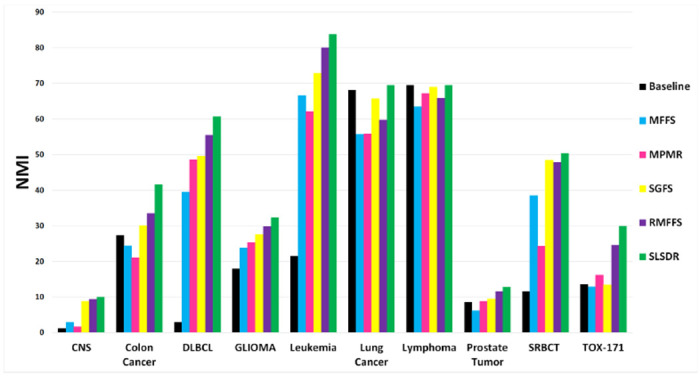
The NMI average values (the y-axis) versus the seven datasets (the x-axis). (A bigger value of NMI indicates a better clustering performance.)

The NMI average values (the y-axis) versus the seven datasets (the x-axis). (A bigger value of NMI indicates a better clustering performance.)