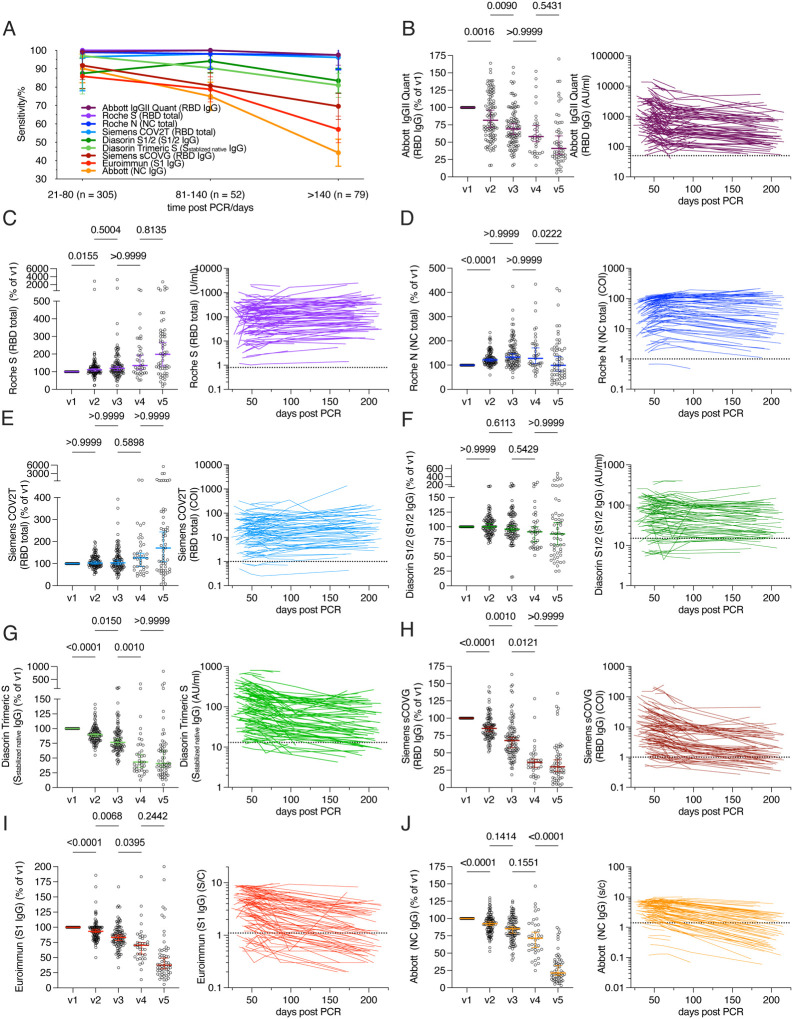
Figure 2 -. Serological analysis of longitudinal COVID-19 patient sera.
(A) Sensitivity of the indicated serological assays in samples collected at three different time-intervals post PCR, as indicated. Mean with 95% confidence intervals are shown. (B–J) Relative serological results at visit 1–5 (v1-5), normalized to visit 1 (left panels) as well as serological results per participant over time with each line representing a single participant (right panels) for the assay indicated. Horizontal bars in B–J indicate median with 95% confidence interval and statistical significance was determined with the Kruskal-Wallis test and subsequent Dunn’s multiple comparisons test. Dotted lines indicate serological assay thresholds.

