
Figure 5.
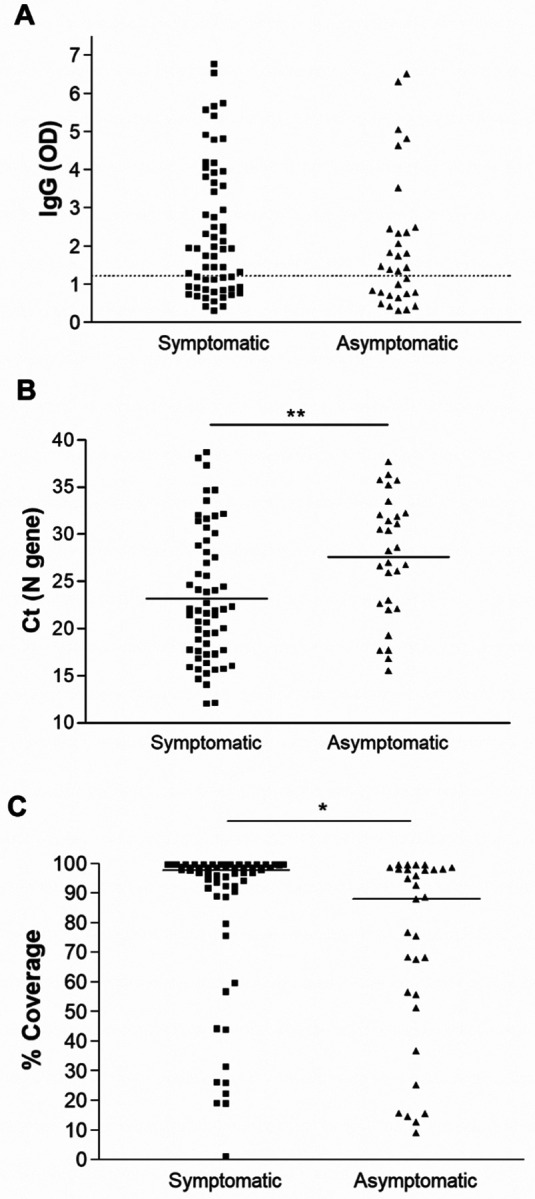
Local antibodies, viral loads, and recovery of whole genomes in symptomatic versus asymptomatic vaccinated individuals. A) IgG levels by ELISA in the upper respiratory samples. B) Comparison of Ct values distribution between symptomatic and asymptomatic groups. C) % genome coverage in symptomatic and asymptomatic groups. Dashed line demarcates the limit of borderline and negative ELISA results as specified per assay’s package insert. * p < 0.05, ** p < 0.005