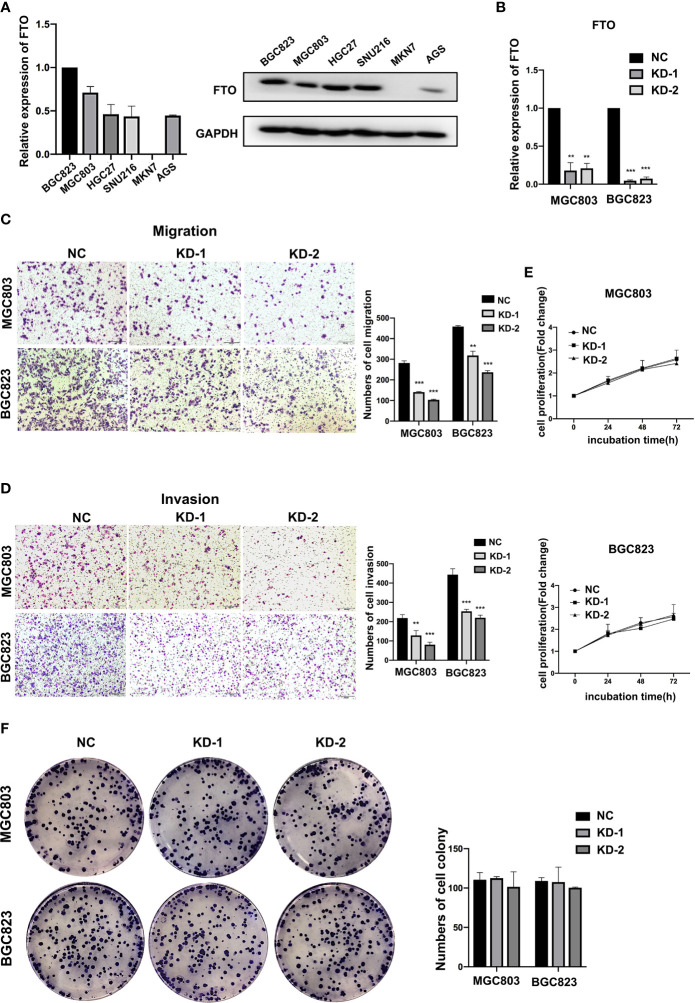
Figure 2.
FTO promoted GC cell migration and invasion. (A) The relative mRNA and protein expression of FTO in different gastric cancer cell lines were detected by qRT-PCR and Western blot. (B) The knockdown efficiency of FTO in BGC823 and MGC803 cells was detected by qRT-PCR. (C, D) The migration and invasion ability of BGC823 and MGC803 cells after transfected with siNC or FTO siRNAs was examined by transwell assay (original magnification, 100×). The columns on the right are quantified by counting 3 fields, and presented as the mean ± standard deviation. (E, F) The proliferation ability of BGC823 and MGC803 cells after transfected with siNC or FTO siRNAs was examined by MTT and colony-formation assay. The columns are presented as the mean ± standard deviation. Data are presented as the mean ± SD of three independent experiments. **P < 0.01, ***P < 0.001. 18S was used as an internal control for all qRT-PCR experiments. GAPDH was used as an internal control for all western blot assays.

