
Figure 2.
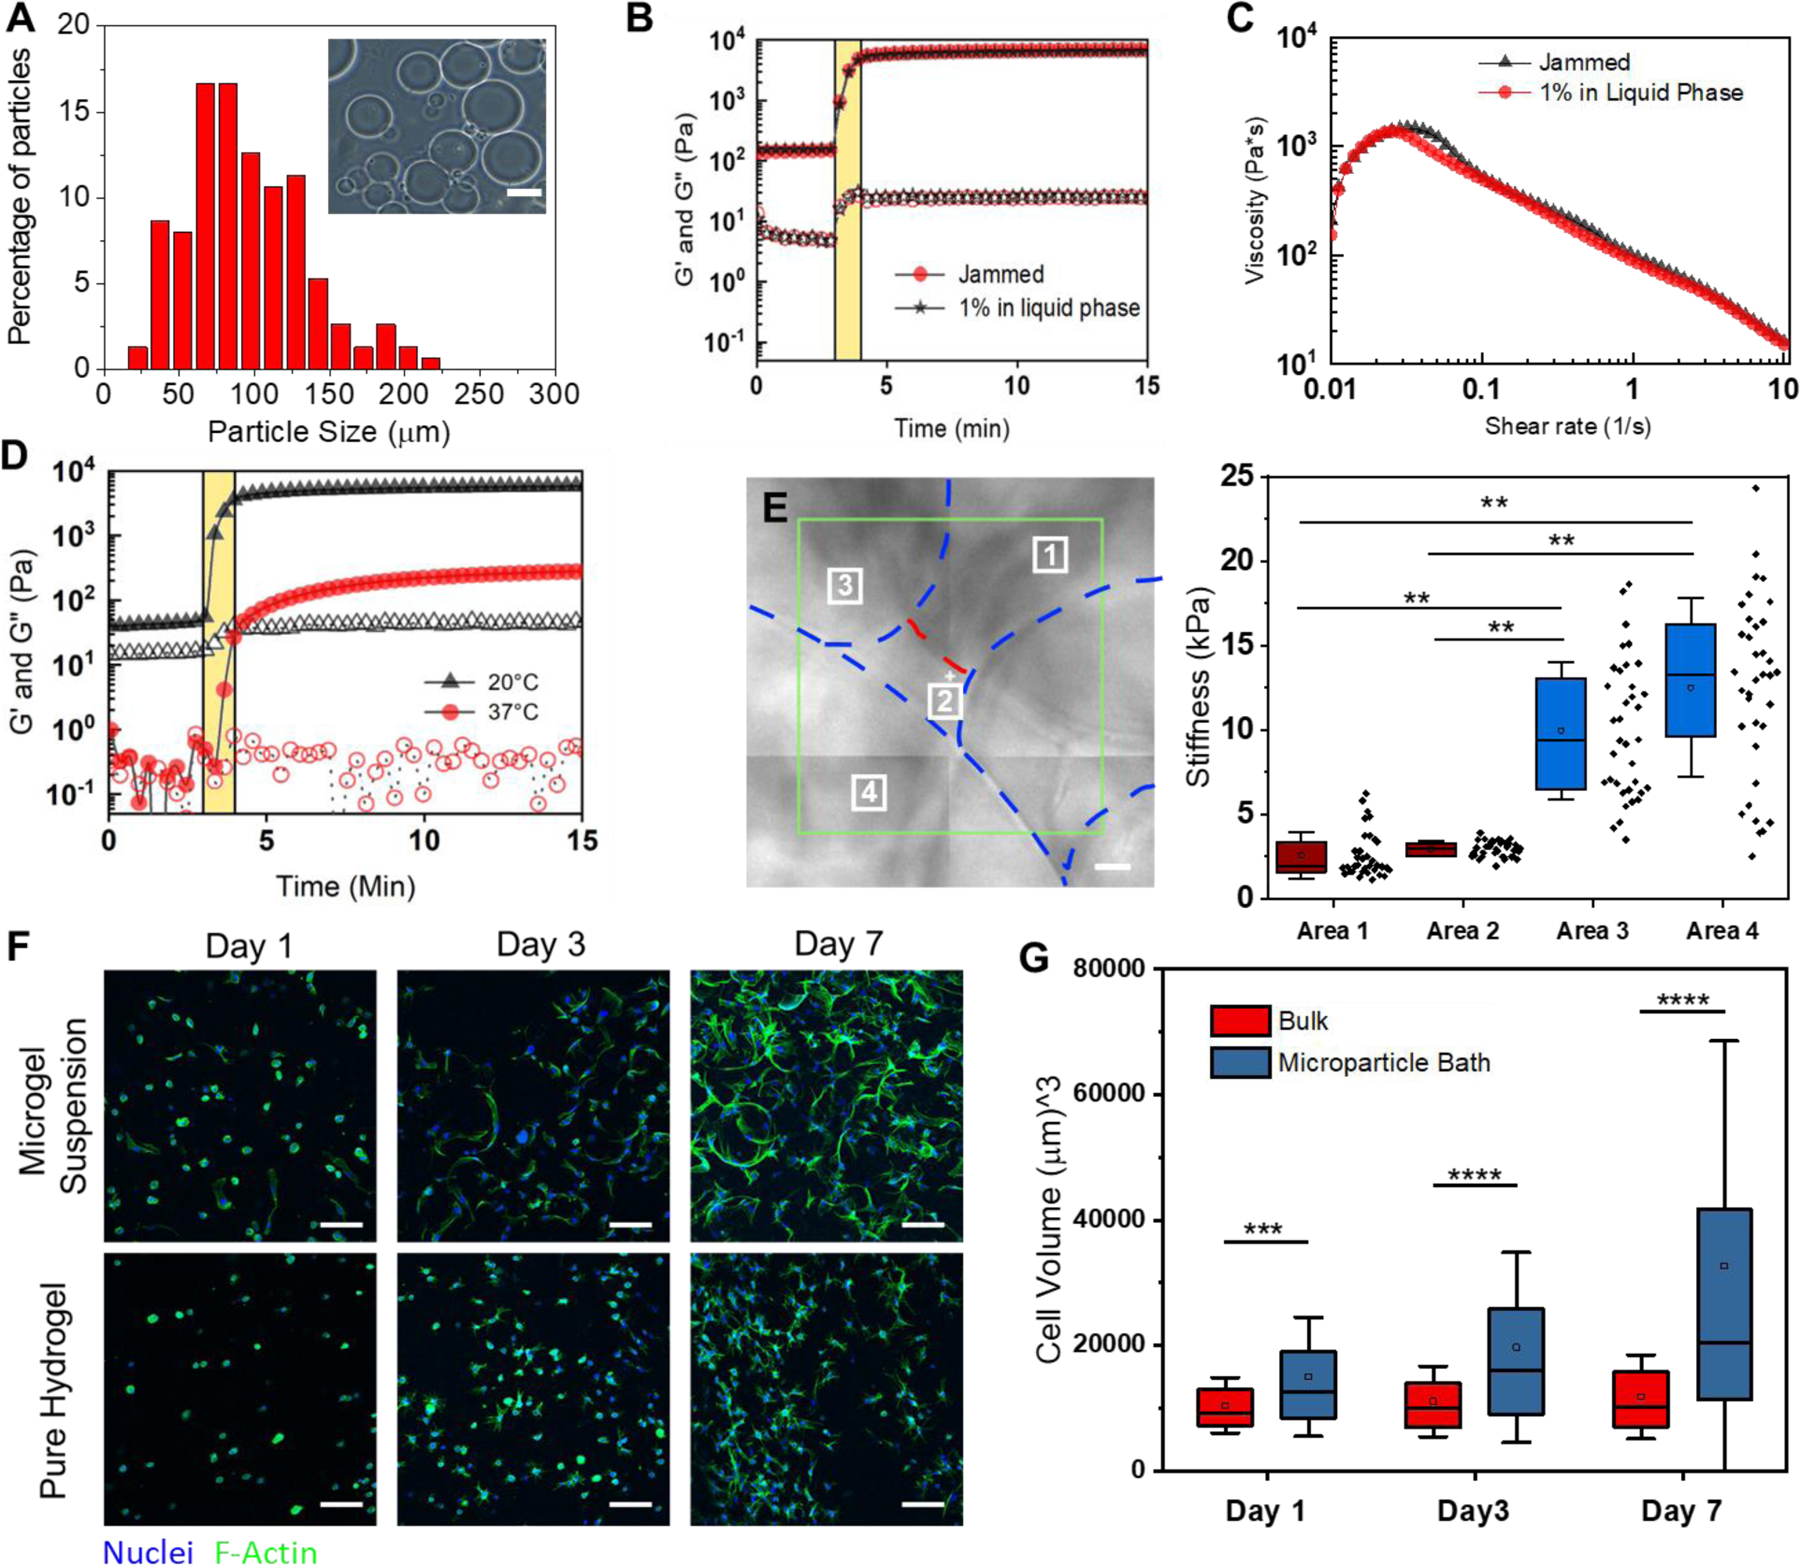
Characterization of GelMa microparticle support suspensions for 3D printing. A) Size distribution (n=100) of the 10 wt% GelMa microparticles. Inset image is a representative optical image of the microparticles. B) Rheological analysis of the gelation of suspensions with (red markers) and without (black markers) a 1 wt% GelMa filler in the liquid phase. Closed markers are the storage modulus (G’) and open markers are the loss modulus (G”) The yellow bar indicates UV crosslinking. C) Uncrosslinked microgel viscosity as a function of Shear rate for suspensions with (red markers) and without (black markers) filler. D) Effect of melting a microgel suspension (red markers) on the storage modulus (G’) when compared to unmelted heterogenous suspension (black markers). The yellow bar indicates UV crosslinking. E) Contact mode atomic force microscopy (AFM) over 4 regions of a suspension bath surface. Force curves (n = 36 per square) were taken at each 10μm x10μm region of the surface where the analyzed young’s modulus is plotted for each region’s curves. F) Z-stack Projections (100μm z-stacks of 50 slices) of ADSCs stained with Hoechst(blue) and Phalloidin (green) in microgel suspensions and a pure hydrogel (10 wt% GelMa) G) Box plots of cell volume quantification of microgel suspensions vs pure hydrogels over 7 days (*** = p < 0.001, ** = p < 0.0001). Scale bars: 10μm (E), 100μm (F).