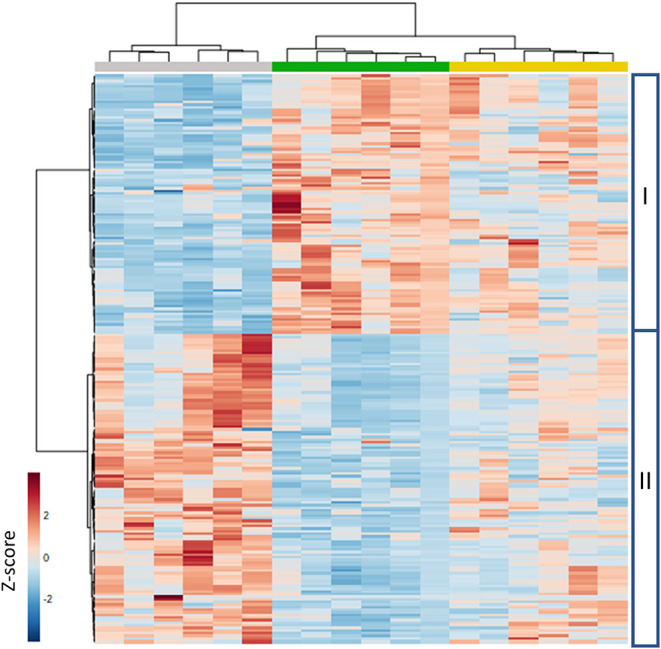
Figure 11.

Hierarchical cluster analysis of selected (ANOVA, P < 0.05; fold change > 2) semi-polar metabolites in strawberry leaf metabolomes. A color-coded matrix represents the Z-score of the metabolite intensity in six biological replicates of strawberry leaves. I and II represent clusters of mass features induced (I) or reduced (II) upon MeJA application. Characteristics of the underlying metabolites are presented in Supplementary Table 2. Gray: mock-treated plants; green: MeJA-treated every 3 weeks; yellow: MeJA treatment upon scouting.
