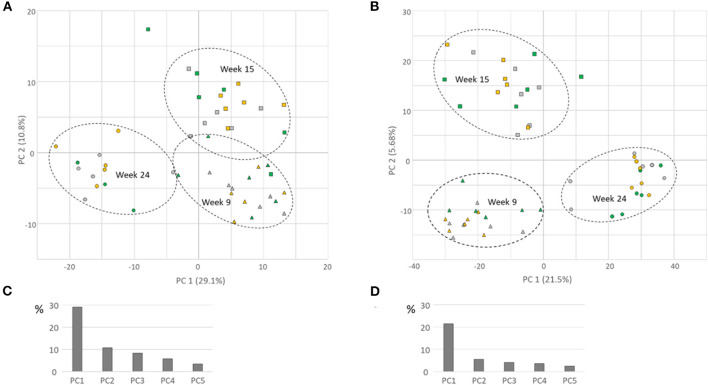
Figure 9.
Leaf metabolomes of strawberry plants in week 9 (triangles), 15 (squares), and 24 (circles). Principal Component Analysis (PCA) of mass signals obtained in positive ionization mode (A) and negative ionization mode (B). Bar diagrams show the variance that can be explained by the first five components (PCs) for positive (C) and negative (D) ionization mode. Gray symbols: mock-treated control plants; green symbols: MeJA-treated every 3 weeks; yellow symbols: MeJA treatment upon scouting.

