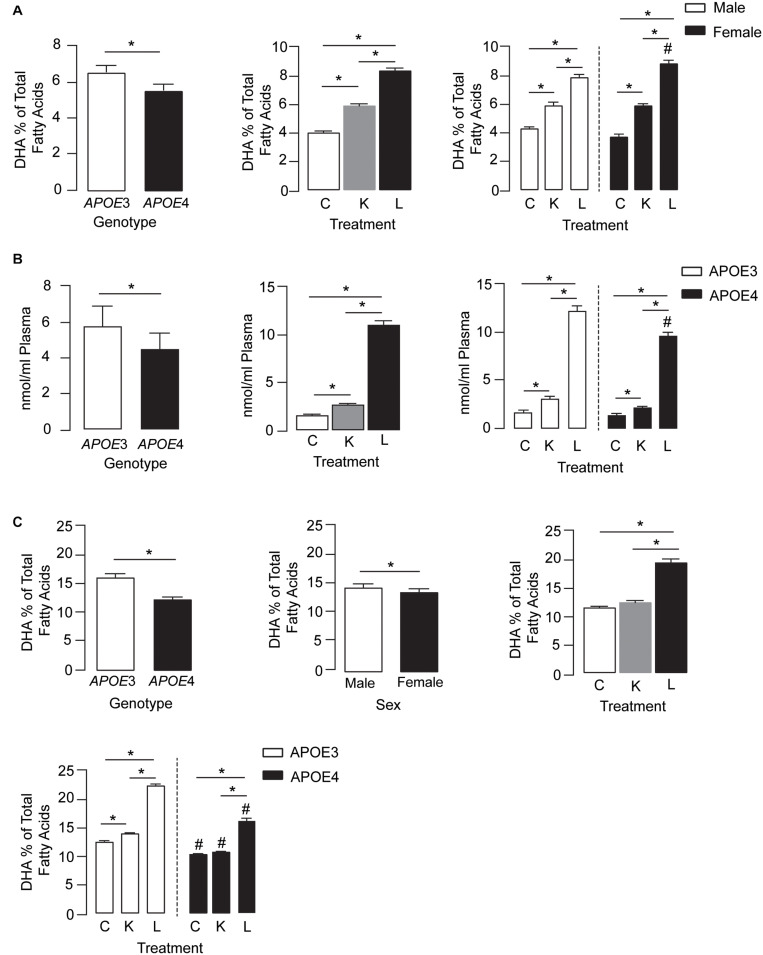
FIGURE 1.
LT-krill oil treatment resulted in enriched plasma and brain levels of DHA in male and female APOE3-TR and APOE4-TR mice. (A) The DHA percentage of total fatty acids in the plasma was lower in APOE4 mice than in APOE3 mice [F(2, 48) = 108.9, p < 0.0001] and differed between mice treated with LT-krill oil, krill oil, and control diets [F(2, 48) = 669.7, p < 0.0001]. In addition, there was a treatment × sex interaction [F(2, 48) = 21.58, p < 0.0001]. In both male and female mice, LT-krill oil treatment resulted in higher plasma levels of DHA than krill oil (males: p < 0.0001; females: p < 0.0001) or control (males: p < 0.0001; females: p < 0.0001). However, female mice treated with LT-krill oil had higher plasma DHA levels than male mice treated with LT-krill oil (p = 0.022). (B) Plasma concentrations of LPC-DHA (nmol/ml plasma) were lower in APOE4 female mice than in APOE3 female mice [F(1, 30) = 29.56, p < 0.0001] and were altered by treatment [F(1, 30) = 655.9, p < 0.0001] in the order of LT-krill oil > krill oil > control diets. Treatment × genotype interaction also impacted plasma concentrations of LPC-DHA [F(1, 30) = 8.91, p = 0.0009]; the magnitude of the increase in LPC-DHA levels with LT-krill oil treatment was larger for APOE3 than APOE4 mice. (C) APOE [F(2, 60) = 389.1, p < 0.0001], sex [F(2, 60) = 16.63, p = 0.0001], treatment [F(2, 60) = 655.6, p < 0.0001], treatment × APOE genotype [F(2, 60) = 36.32, p < 0.0001], and treatment × sex [F(2, 60) = 4.27, p = 0.018] all impacted hippocampal DHA levels. For the independent effects, DHA levels were lower with APOE4 compared with APOE3, in females compared with males, and followed the order LT-krill oil > krill oil = control. The treatment × APOE genotype interaction was likely driven by the fact that that krill oil alone enriched hippocampal DHA levels in APOE3 but not in APOE4 mice, and that for every treatment, DHA levels were higher in APOE3-TR mice. All data expressed as mean ± SEM. *p < 0.05 by three-way ANOVA and Tukey’s post hoc analysis. #Different from APOE3 by Tukey’s post hoc analysis, p < 0.05. See Supplementary Table 1 for details on n sizes and statistical comparisons. C, control diet; K, krill oil diet; L, lipase-treated krill oil diet.

