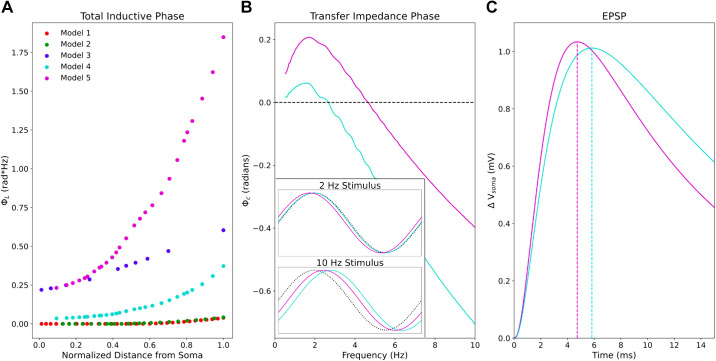
Figure 4.
The impedance phase in PT models and its implications for synaptic potentials. A: model 5 exhibits much greater total inductive phase along the apical trunk compared with the other models. B: comparison of two models’ transfer impedance phase profiles from halfway along the apical trunk (136.4 μm from the soma) showing Φcis greater in model 5 than in model 4 for all frequencies probed. Inset shows somatic Vmemb response to 2 Hz and 10 Hz sinusoidal stimuli in the time domain from both models. At 2 Hz, Vmemb leads the stimulating current by roughly 17 ms in model 5, whereas they are nearly synchronous in model 4. At 10 Hz, lag in Vmemb is reduced in model 5 compared with model 4. Dotted black lines indicate the stimulating current waveform. C: somatic EPSP in response to synaptic stimulation in both models at the same point along the apical trunk. Peak Vmemb occurs more than 1 ms earlier in model 5 than in model 4. EPSP, excitatory post-synaptic potential; PT, pyramidal tract neuron.

