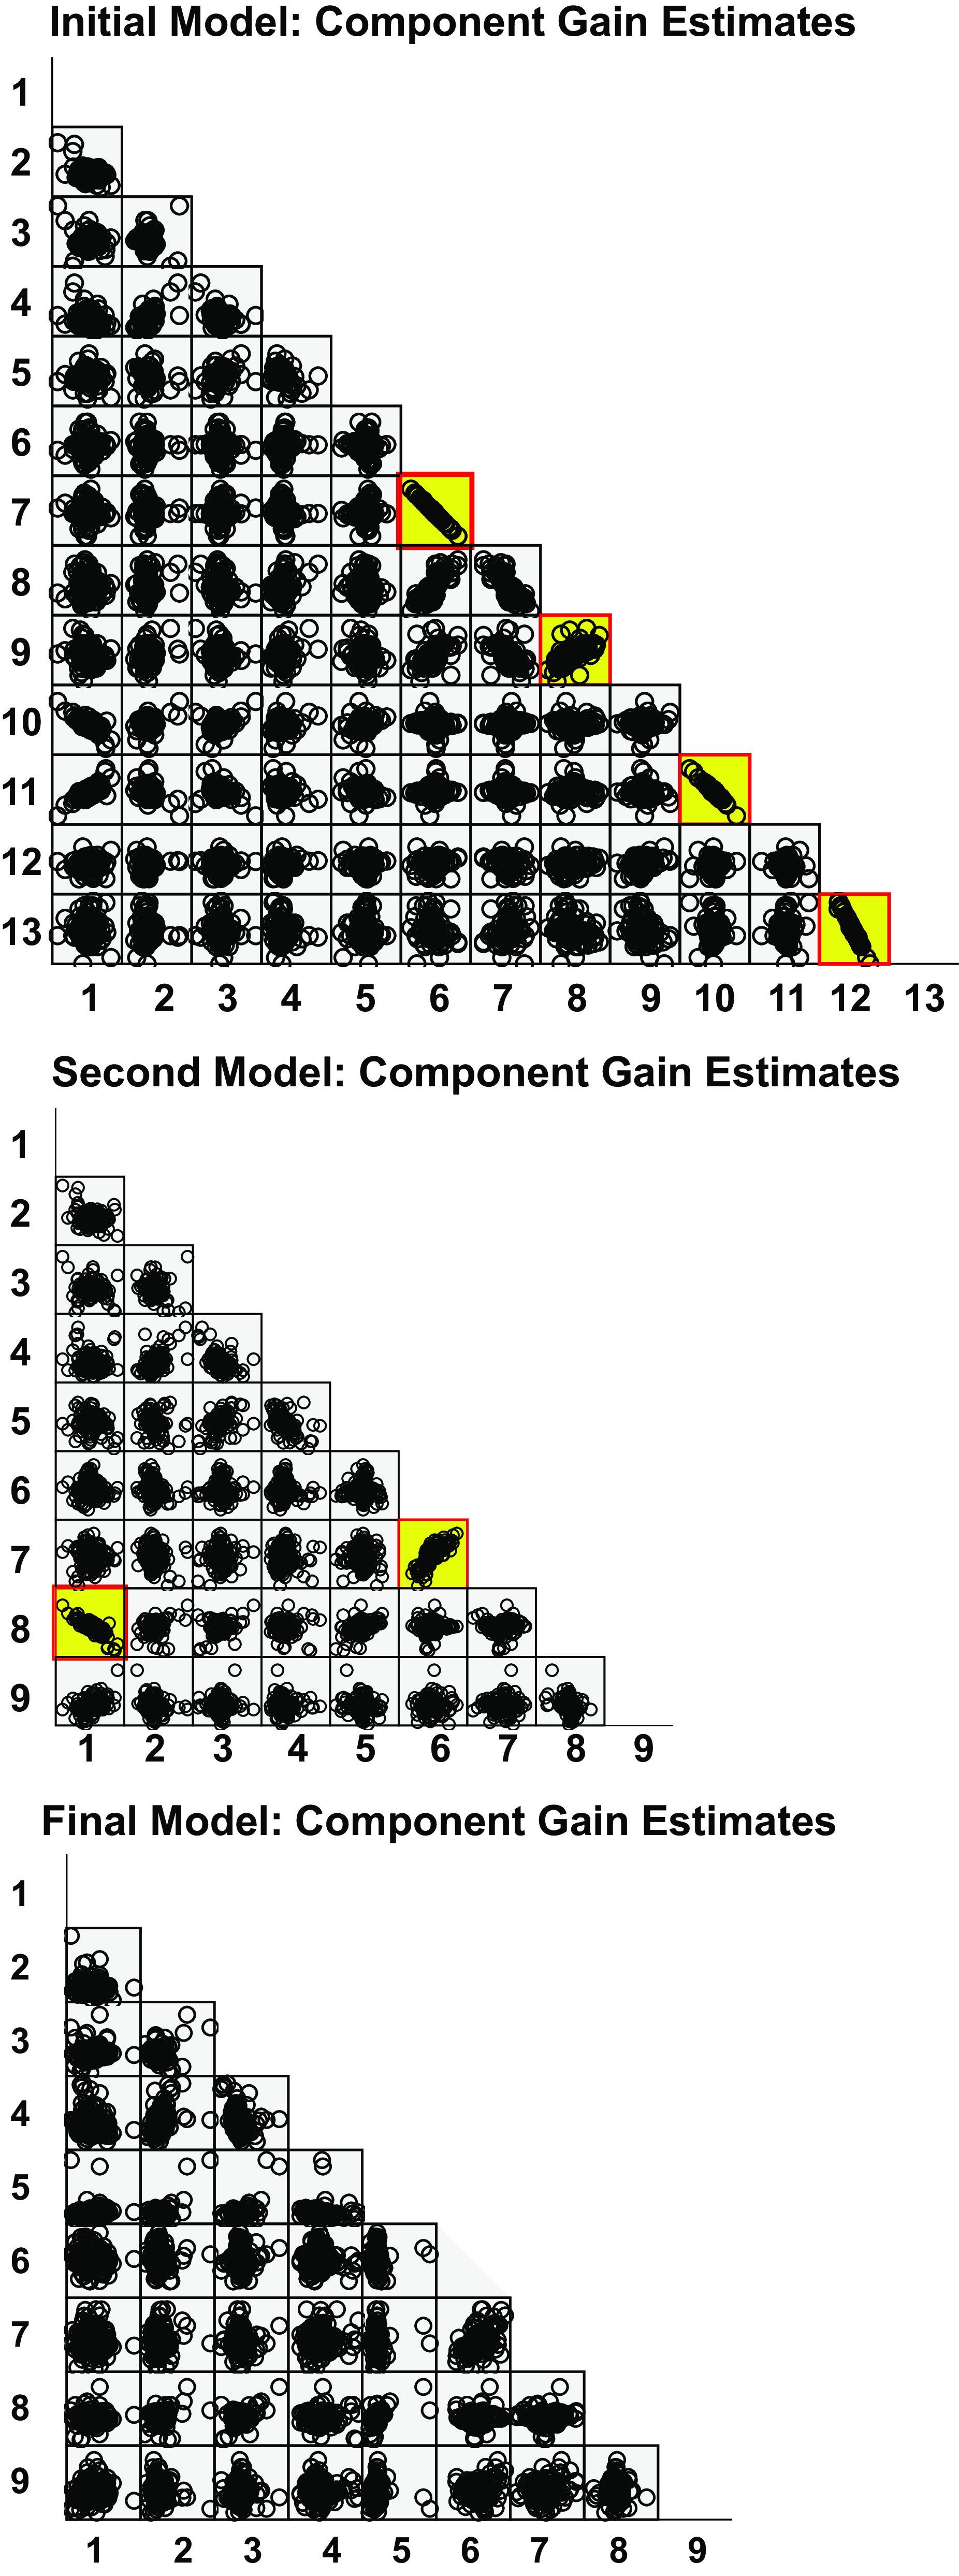
Figure 4.

Iterative scatterplot matrices of model component estimates. The initial (top), second (middle), and final (bottom) scatterplot matrices are shown. Linear correlations (validated by regression modeling) are highlighted in yellow. Numbered parameters for each model iteration correspond to those shown in the methods.
