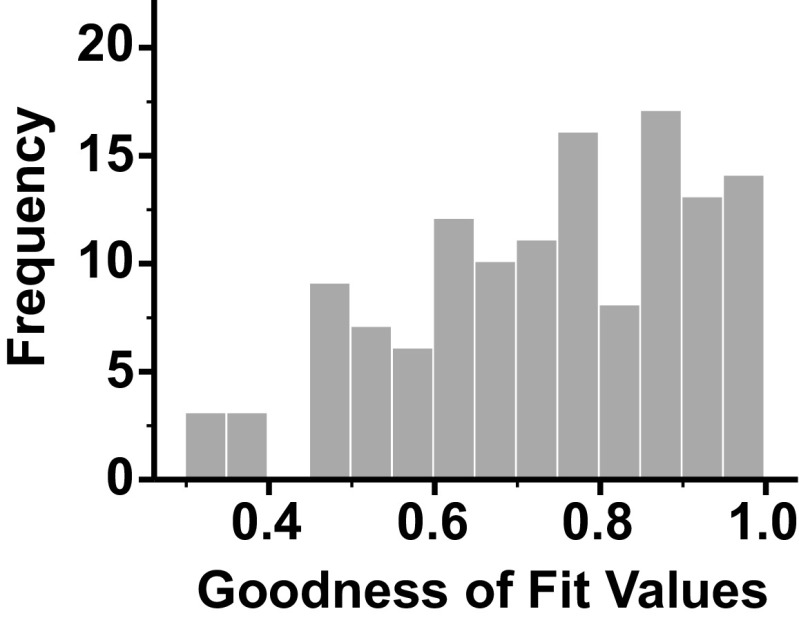
Figure 6.
A histogram of the distribution of R2 values for the fit of an additive model of low and high pass filtered limb and table movement dynamics (indicative of limb proprioceptive and vestibular signals, respectively) using least squares nonlinear regression to neural firing of individual vestibular nucleus (VN) neurons.

