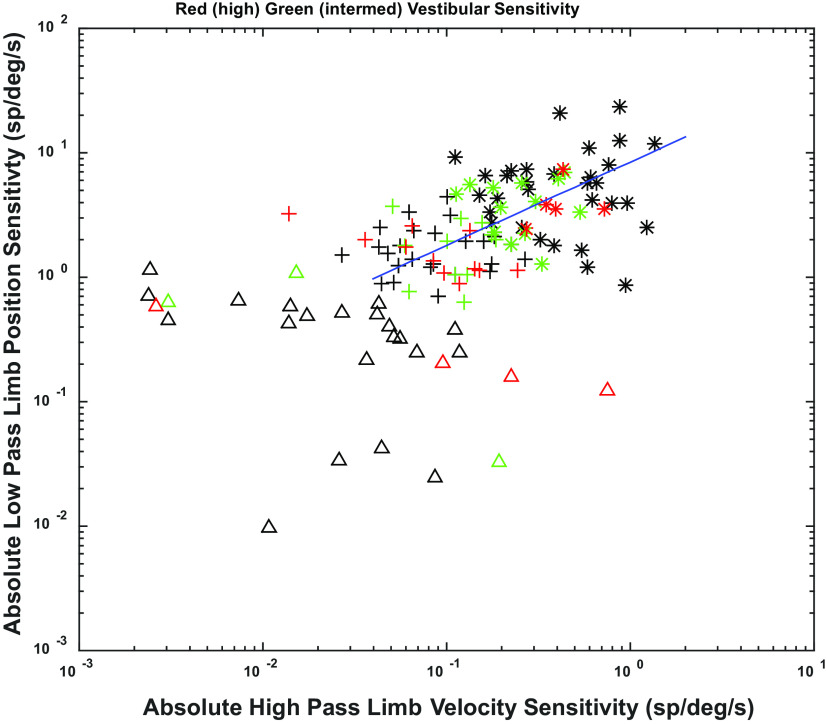
Figure 8.
Plot of low pass (LP) limb position sensitivity vs. high pass (HP) limb velocity sensitivity on a log-log scale. Fuzzy cluster analysis reveals three groups of units, which we term high (*), intermediate (+) and low (△) combined limb sensitivity. Vestibular sensitivity of units is shown superimposed on these units by color with high sensitivity being shown as red, intermediate as green, and low as black. A fractional exponential relationship for LP limb position and HP limb velocity sensitivities was detected (shown as regression line on chart).

