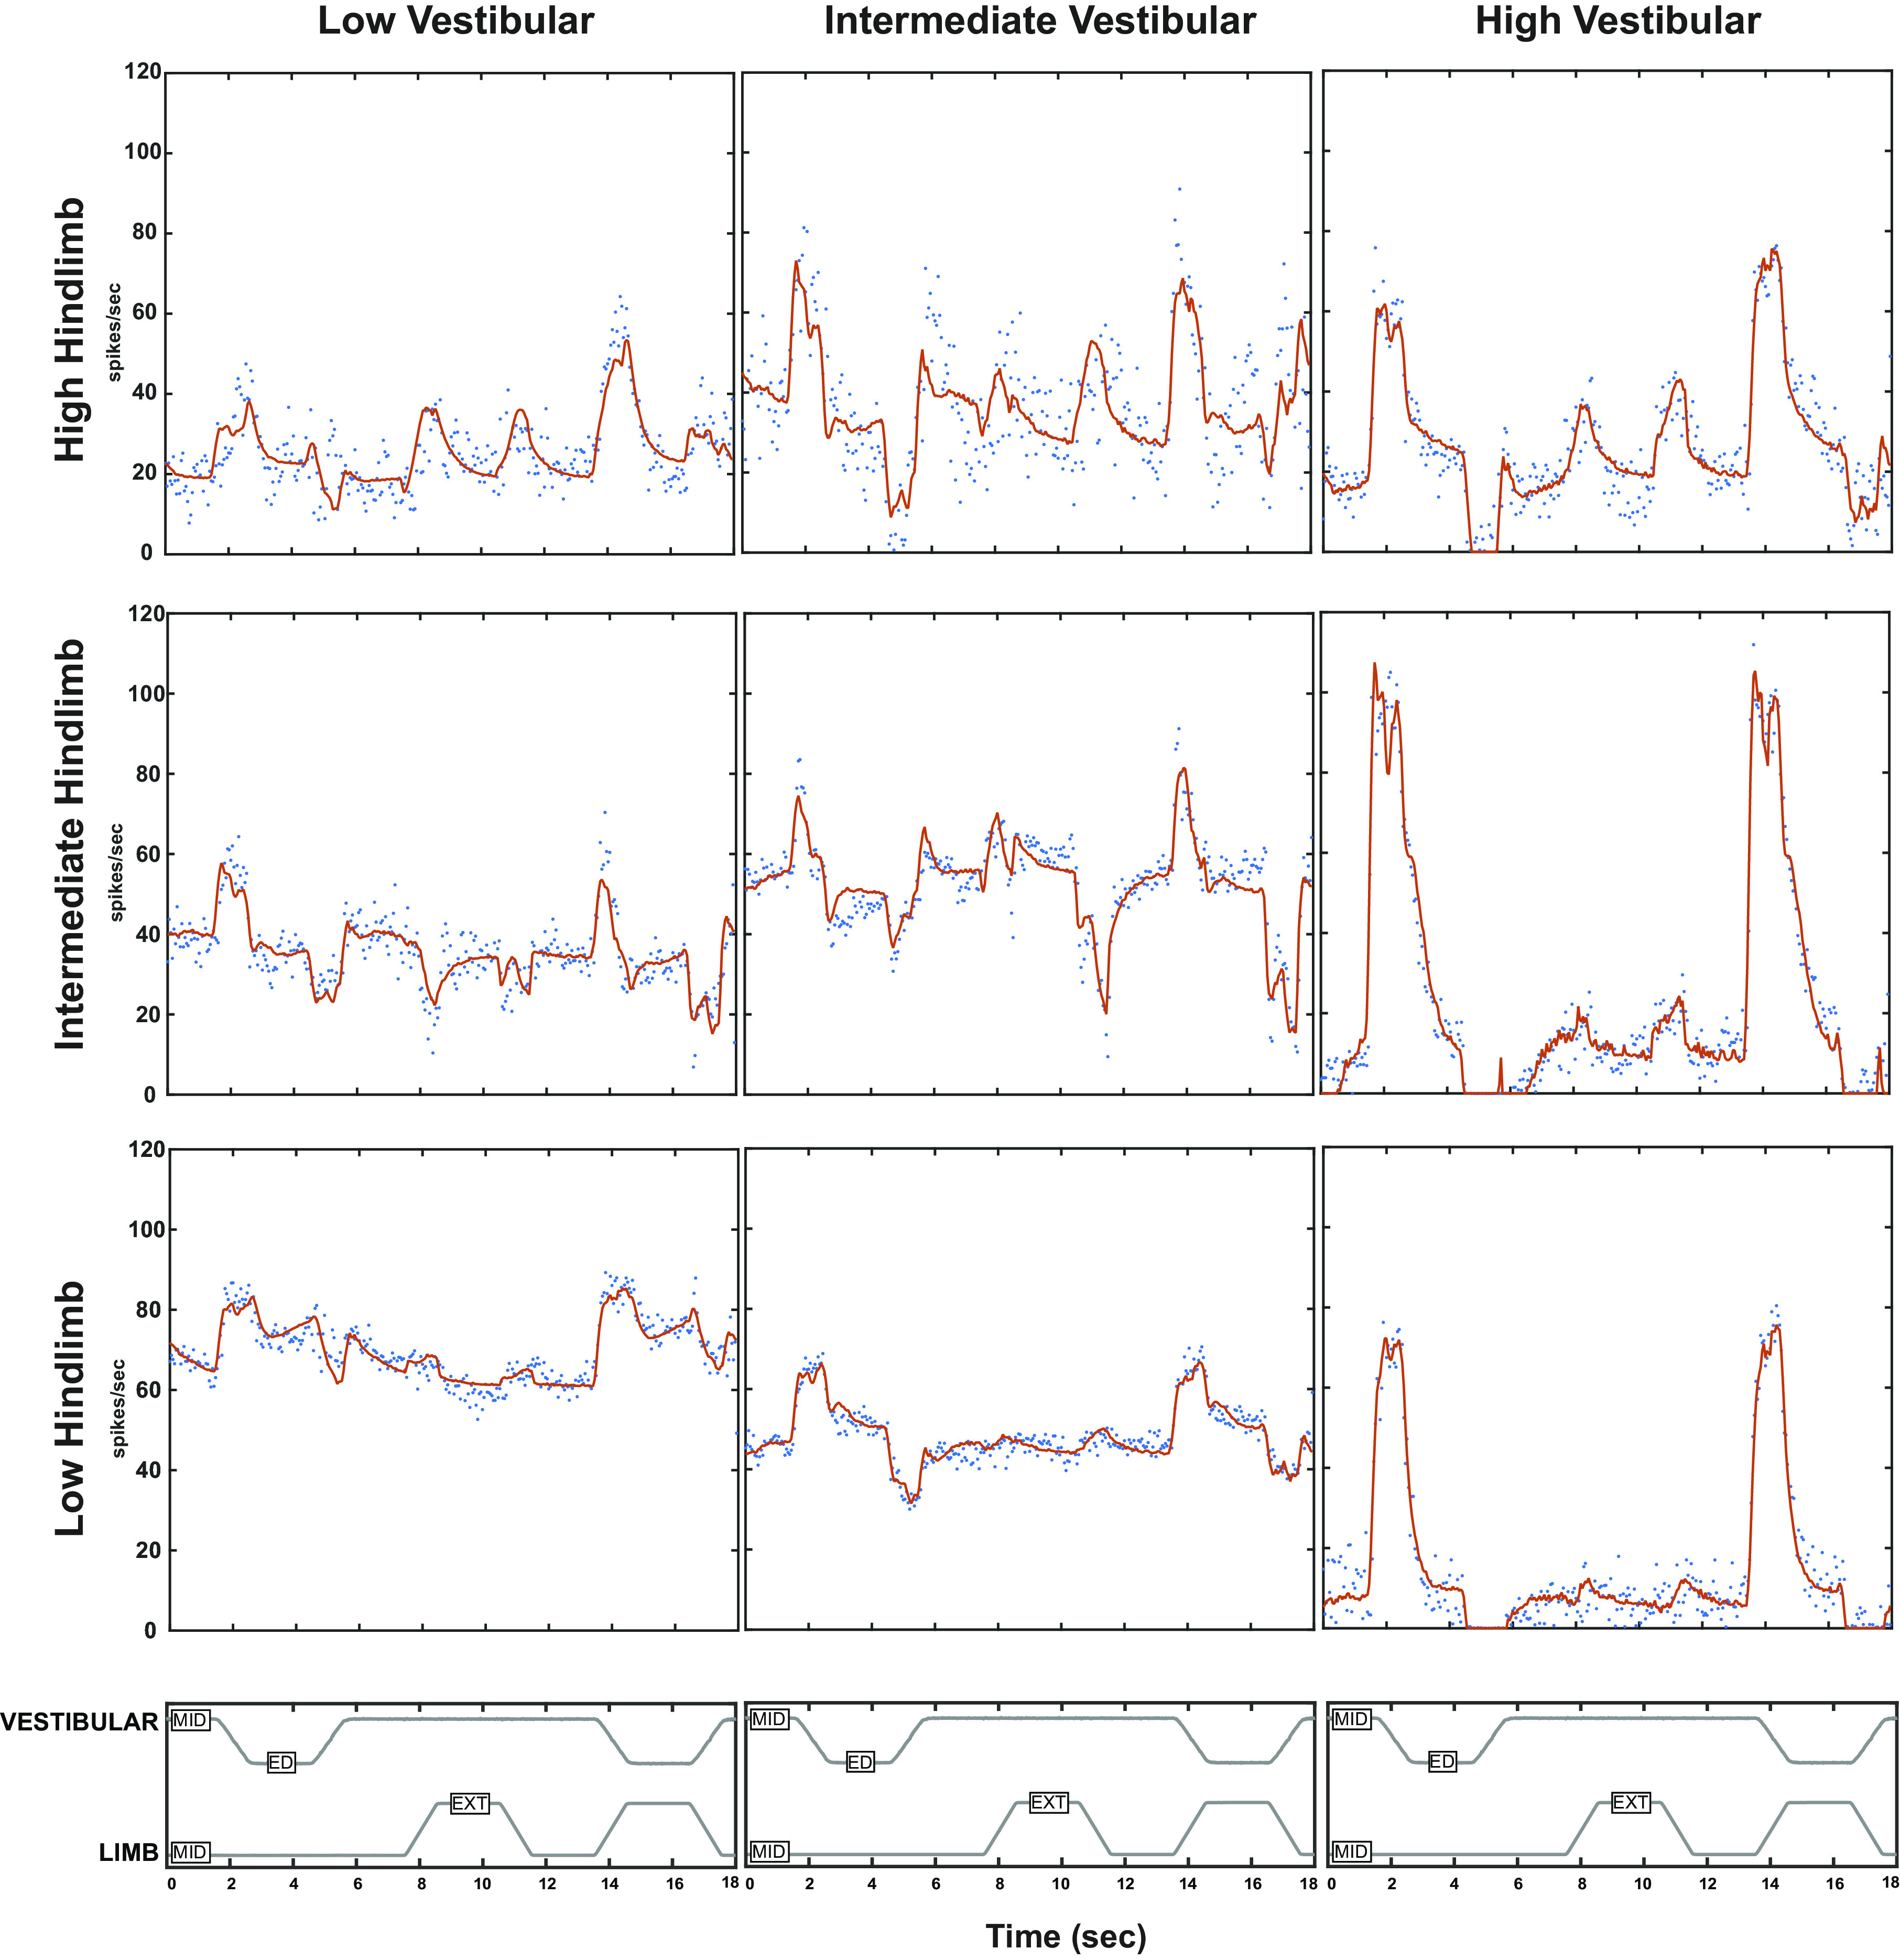
Figure 9.

Examples of unit responses summarized in Fig. 8. The stimulus profile for whole body roll (MID designates static in horizonal plane, ED designates ear down tilt) and hindlimb movement (MID designates resting position, EXT indicates extension) shown in the top panels. The unit spike response rates are shown in blue and the red curves show the model fit (including parameters graphed in Fig. 8), The units are organized to show the vestibular and hindlimb proprioceptive response components and their additivity. The columns are arranged by increasing vestibular sensitivity (high indicated by red symbols in Fig. 8, intermediate by green symbols, low by black symbols). The rows indicate different levels of hindlimb sensitivity (in Fig. 8; high indicated by *, intermediate by +, and low by △). ED, ear down; EXT, extension; LP, low pass; MID, midline.
