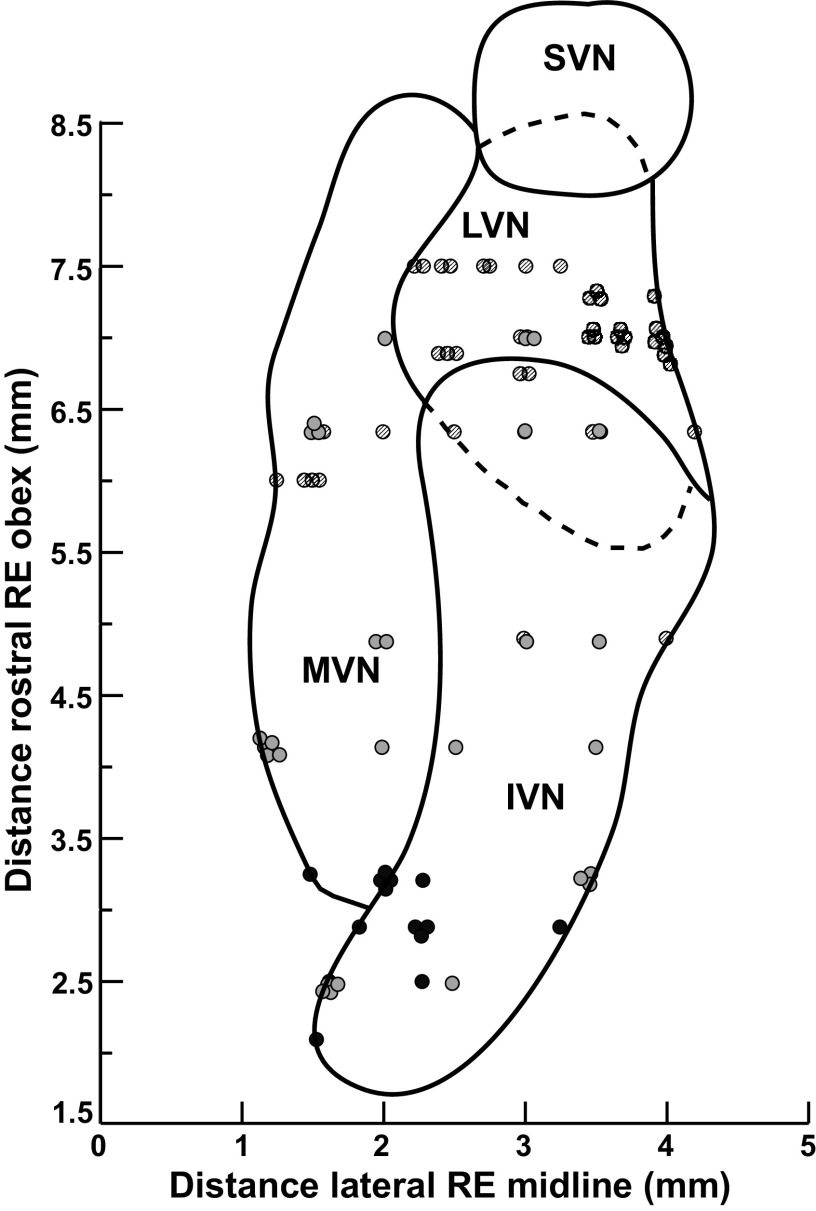
Figure 11.
A horizontal section through the vestibular nucleus complex showing the location of neurons whose activity was recorded in this study. The y-axis designates the distance in millimeters rostral to the obex, and the distance in millimeters lateral to the midline is shown on the x-axis. The activity of neurons was recorded over a rostral-caudal distance of 6 mm, from 2.1 mm to 8.1 mm rostral to the obex. Symbol shading indicates neurons recorded from different cats. IVN, inferior vestibular nucleus; LVN, lateral vestibular nucleus; MVN, medial vestibular nucleus; RE, relative to; SVN superior vestibular nucleus.

