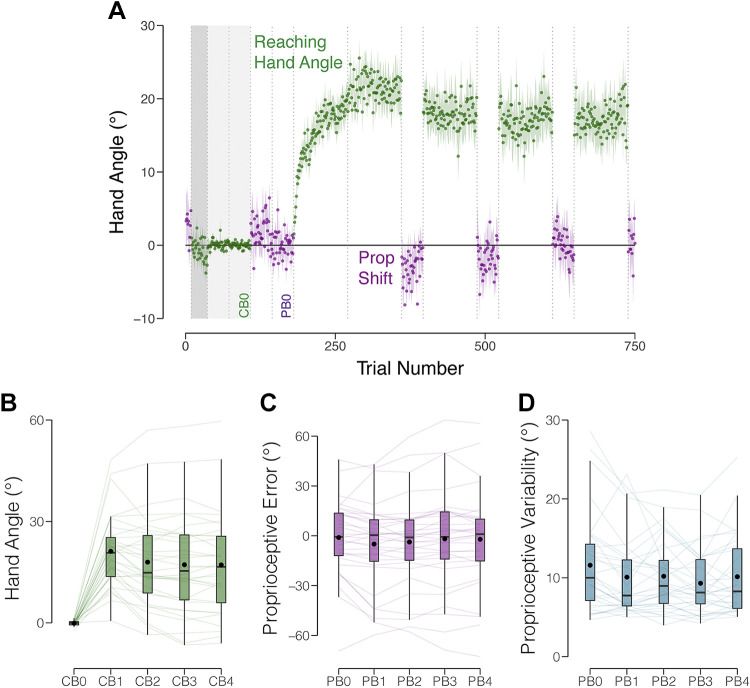
Figure 5.
Performance on adaptation and proprioception probe tasks in experiment 2. A: group means across test session. After a period of no feedback (dark gray region) and veridical feedback (light gray region) baseline trials, participants were exposed to a visual clamp in which the feedback was offset by 15° from the target. Participants performed blocks of reaching trials (hand angle shown in green) and proprioceptive probe trials (shift in perceived position shown in purple). Vertical dotted lines indicate block breaks. Shaded regions indicate ±SE. Baseline blocks for reaching hand angle (CB0) and proprioceptive probes (PB0) are labeled. B: mean hand angle averaged over the last three clamped feedback blocks. C: proprioceptive error for each proprioceptive block. D: variability of proprioceptive judgments for each proprioceptive probe block. Thin lines indicate individual subjects. Box plots indicate min, max, median, and the 1st/3rd interquartile range. Black dots indicate the mean.

