Figure 5.
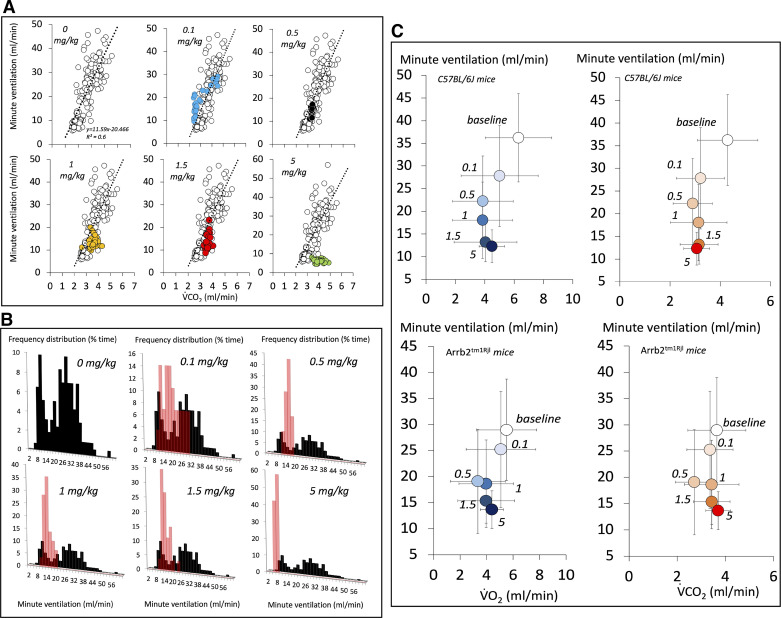
A: comparison of the V̇e-V̇co2 relationship following fentanyl administration in the control mouse shown in Fig. 2. Note that in up to 1.5 mg/kg dose, this relationship still falls along the regression line established in baseline conditions, whereas at higher fentanyl doses an inhibition of breathing independent of the metabolic rate was observed (see text for more details). Due to the method of average used to compute ventilation, the periods of locomotion and immobility cannot be separated in these figures. B: frequency distribution of ventilation following an injection of fentanyl (from 0.1 mg/kg ip to 5 mg/kg ip) in the control mouse shown in Fig. 2. The frequency distribution of the prolonged baseline data is displayed in black. The effects of fentanyl (up to 1 mg/kg) consisted in a reduction of ventilation (red bars), which overlapped the peak corresponding to the lowest spontaneous levels of ventilation reached when the animals were immobile. Above these concentrations, minute ventilation decreased to levels that were lower than the lowest levels of ventilation reached in baseline breathing. C: average data (means ± SD over 15-min periods) showing the V̇e/V̇o2 and V̇e/V̇co2 relationships before and following fentanyl exposure in keeping with the doses in all of the mice. Arrb2tm1Rjl, Arrb2 knockout mice.

