
FIGURE 2.
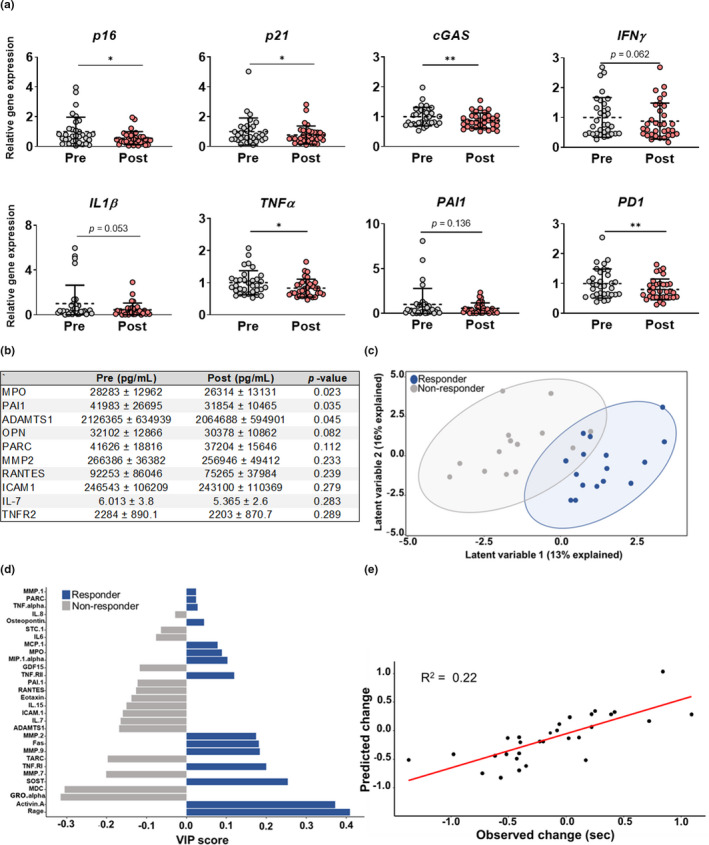
Biomarkers of cellular senescence are predictive of functional adaptation to exercise. (a) Expression of cellular senescence markers in CD3+ T cells at baseline and following the intervention period. (b) Concentrations of circulating senescence‐related proteins before and after the intervention. (c) The PLSDA‐derived index of senescent cell burden differentiates between subjects who showed improvements in the timed up and go measure (responders [blue]) and those who did not (non‐responders [gray]) in response to the intervention. (d) VIP scores, which rank SASP factors on their importance for differentiating between responders (blue) and non‐responders (gray). (e) Predicted and observed change in gait speed using the SASP index. Results are mean ± SD. *p < 0.05, **p < 0.01