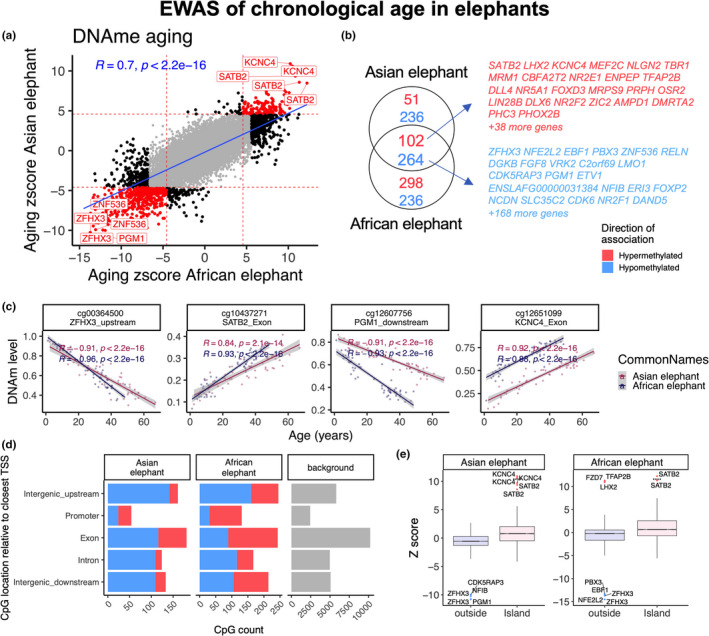
FIGURE 2.

Epigenome‐wide association (EWAS) of chronological age in the blood of African elephants (Loxodonta africana) and Asian elephants ( Elephas maximus). (a) Similarities in DNA methylation aging effects between African and Asian elephants. The red lines indicate p < 10−5 (Bonferroni corrected threshold) in each axis. The top shared CpGs are labeled with proximate genes using the Loxodonta_africana loxAfr3.100 genome assembly. (b) Venn diagram of the overlap of top aging CpGs between African and Asian elephants. Top CpGs were selected at p < 10−5 and further filtering based on z score of association with chronological age for up to 500 in a positive or negative direction. (c) Scatter plot of top shared aging CpGs in elephants. (d) Location of aging CpGs in each species relative to the closest transcriptional start site. The gray color in the last panel represents the location of 28,487 mammalian BeadChip array probes mapped to the loxAfr3.100 genome assembly. (e) Box plot analysis of DNA methylation aging effects by CpG island status
