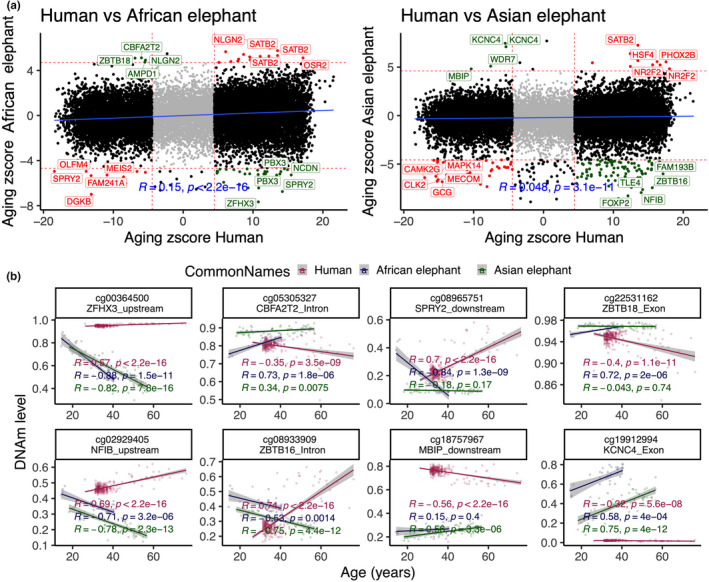
FIGURE 3.

Comparison of DNAm aging between humans and elephants' blood. (a) Sector plot of the DNA methylation aging effects in humans and elephants. Red means shared, and Green indicates divergent aging patterns between humans and elephants. The analysis is limited to 19,138 probes that map to the genomes of both humans and elephants. (b) Scatter plots of select CpGs with divergent aging patterns between elephants than humans
