
FIGURE 2.
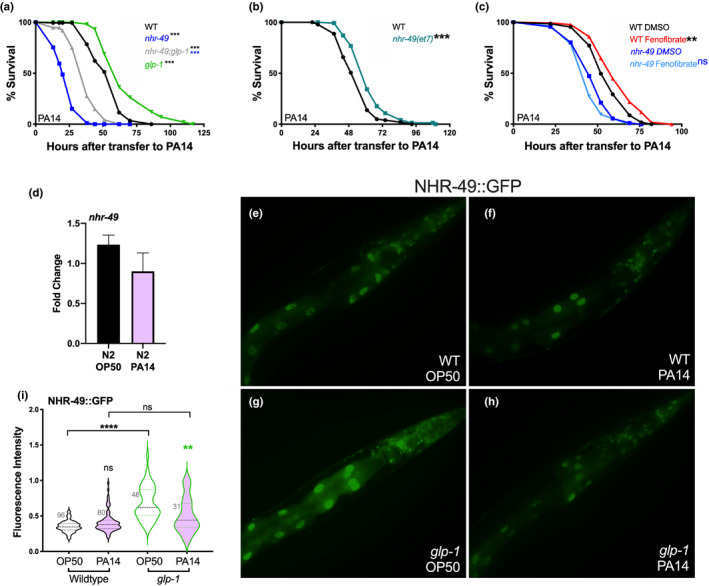
NHR‐49 contributes toward defense against P. aeruginosa pathogen attack. (a) Survival on PA14 of L4 stage wild‐type worms (WT, black, m = 54.03 ± 0.99, n = 151/198) as well as nhr‐49 (blue, m = 23.03 ± 0.62, n = 184/195), glp‐1 (green, m = 67.31 ± 1.86, n = 101/113) and nhr‐49;glp‐1 (gray, m = 37.48 ± 1.02, n = 99/115) mutants. See Tables S3 and S4 for additional trials with these strains. (b) nhr‐49 gof mutants survives longer on PA14. Survival on PA14 of L4 stage WT worms (black; m = 54.32 ± 1.09, n = 126/145) and nhr‐49(et7) mutants (olive, m = 62.79 ± 1.31, n = 94/136). p < 0.0001. Data from additional trials in Table S2A. (c) Fenofibrate supplementation increases survival on PA14. Survival on PA14 of L4 stage DMSO‐control grown, WT worms (black; m = 56.81 ± 1.08, n = 103/129) and nhr‐49 mutants (dark blue, m = 47.69 ± 0.98, n = 107/134) compared with Fenofibrate‐supplemented WT worms (red, m = 62.1 1.26, n = 93/135) and nhr‐49 mutants (light blue, m = 45.33 ± 0.89, n = 104/134). Data from additional trials in Table S2B. (d–i) PA14 exposure reduces NHR‐49 levels. (d) nhr‐49 mRNA levels measured by Q‐PCR in Day 1 adults grown on OP50 till L4 stage then transferred to PA14 plates for 8 h (pink) or continued on OP50 (black). p = 0.27. Data combined from three independent biological replicates, each including three technical replicates. (e–h) Representative images of NHR‐49::GFP in WT (e, f) and glp‐1 mutants (g, h) grown on OP50 till L4 stage and then transferred to PA14 (f, h) or retained on OP50 (e, g) for 24 h. (i) Violin plot quantification of GFP intensity using a COPAS Biosorter. WT (black outlines), glp‐1 (green outlines) exposed to PA14 (pink) or retained on OP50 (blank). Number of worms assayed shown on each panel. Data from one of three biological replicates with similar results. In (a–c), survival data shown as mean life span in hours (m) ± SEM (see Methods for details). In (d), error bars represent standard error of the mean (SEM). In (i), where all fluorescence measures were normalized to time‐of‐flight, the center dashed line indicates median intensity and flanking lines the first and third quartiles. Statistical significance was calculated in (a) and (b) using the log‐rank method (Mantel Cox, OASIS2), in d by using a two‐tailed t test, and in (i) using a one‐way nonparametric ANOVA with Dunn’s post hoc test. Statistical significance is shown on each panel next to a given strain/condition with the color of the asterisk indicating strain/condition being compared to p < 0.01 (**), <0.001 (***), <0.0001 (****), not significant (ns)