
FIGURE 5.
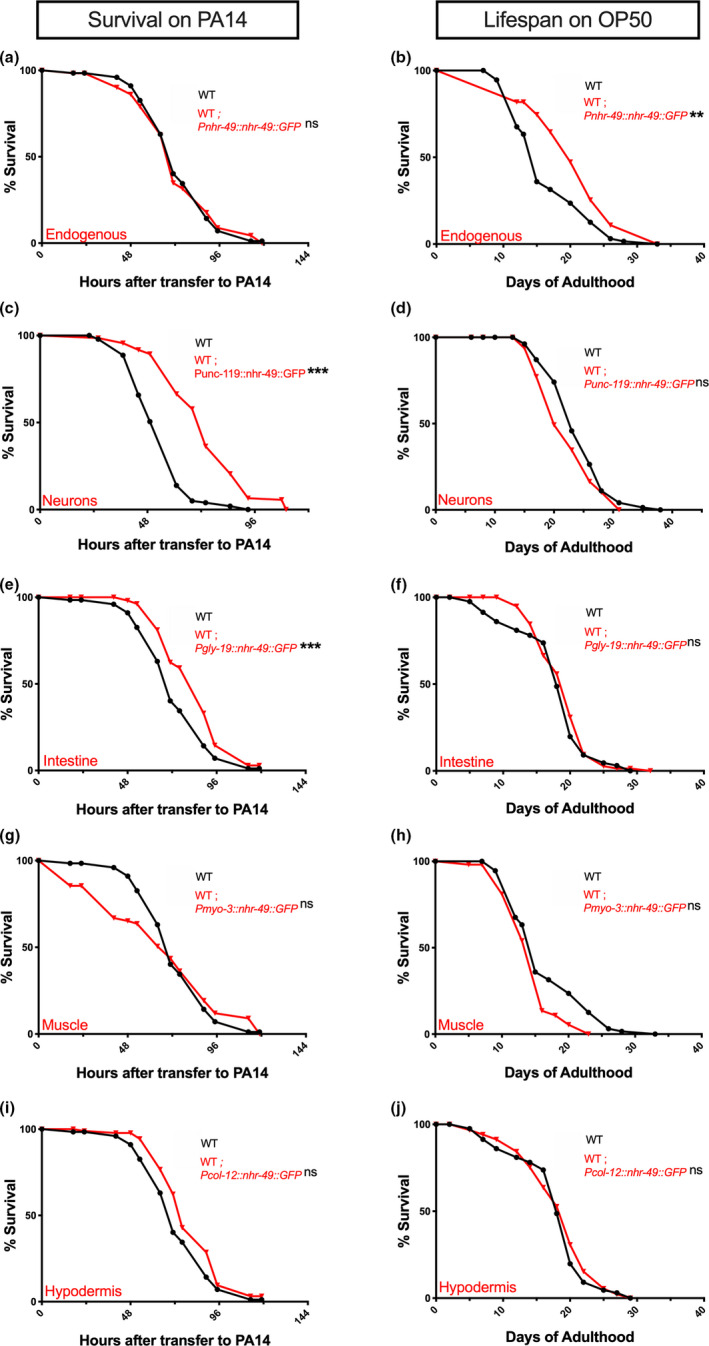
In wild‐type animals, elevating NHR‐49 levels in neurons or intestine enhances immunity. (a, c, e, g, i) NHR‐49 overexpression in neurons or intestine increases immunity. Mean survival on PA14 (in hours) of WT worms (black) and strains overexpressing NHR‐49 in different tissues (red). (a, e, i, g) Survival of WT (76.98 ± 2.25, n = 102/129) and strains overexpressing NHR‐49 via Endogenous promoter (a, 76.89 ± 3.06, n = 75/121) or promoters expressed in Intestine (e, 91.97 ± 2.65, n = 96/124), Muscles (g, 72.11 ± 4.28, n = 66/100), or Hypodermis (i, 82.68 ± 2.65, n = 63/97). (c) Survival of WT (54.32 ± 1.09, n = 125/145) and strain overexpressing NHR‐49 in Neurons (c, 73.72 ± 1.61, n = 114/136). (b, d, f, h, j) NHR‐49 upregulation in individual somatic tissues does not enhance immunity. Mean life span on OP50 (in days) of WT worms (black) and strains overexpressing NHR‐49 in different tissues (red). (b, h) Life span of WT (16.67 ± 0.65, n = 67/73) and strains overexpressing NHR‐49 via Endogenous promoter (b, 20.83 ± 1.01, n = 35/44) or promoter expressed in Muscles (h, 14.6 ± 0.55, n = 39/52). (d) Life span of WT (24.2 ± 0.55, n = 74/91) and strain overexpressing NHR‐49 in Neurons (d, 22.35 ± 0.6, n = 57/94). (f, j) Life span of WT (17.81 ± 0.56, n = 73/121) and strains overexpressing NHR‐49 in Intestine (f, 19.06 ± 0.4, n = 86/116) or Hypodermis (j, 18.3 ± 0.53, n = 95/120). Survival and life span data shown as mean ± standard error of the mean (SEM). “n” refers to number of worms analyzed over total number of worms tested in the experiment (see Methods for details). Statistical significance calculated using log‐rank (Mantel–Cox) method and indicated by asterisks on each panel next to mutant name (color of asterisk indicates strain being compared to). p < 0.01 (**), <0.001 (***), not significant (ns). Note: assays in some panels (a, i, e, g; b, h; f, j) have the same controls as they were performed in the same biological replicate. Data from additional trials are presented in Table S5a–e