
FIGURE 1.
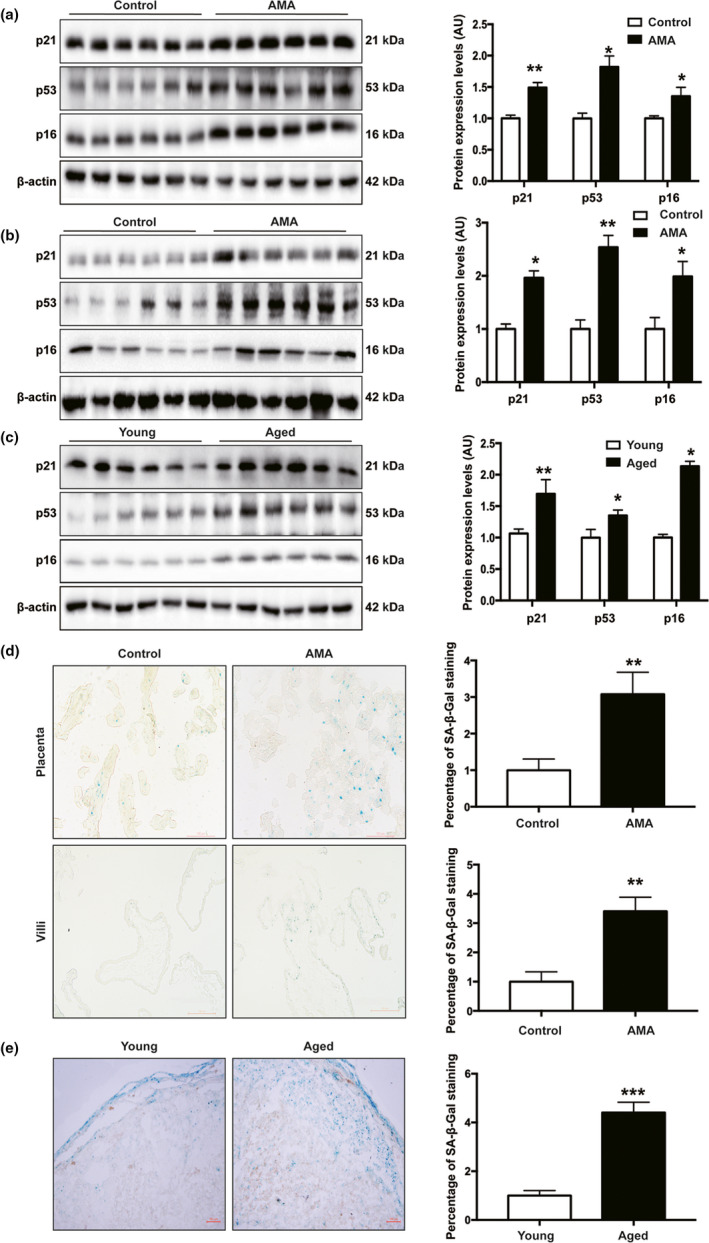
AMA placentas showed a senescence phenotype. (a) Western blotting of p21, p53, and p16 protein expression in human term placentas, n = 30 in the control and n = 37 in the AMA groups; (b) Western blotting of p21, p53 and p16 protein expression in human first trimester villi, n = 6 in each group; (c) Western blotting of p21, p53, and p16 protein expression in mouse placentas collected on GD18.5, n = 6; (d) representative images of SA‐β‐Gal staining of human term placenta sections. Quantification of the area of positive signal per sample (n = 3 patients per group, 3 random fields per patient). Scale bars, 100 μm; (e) representative images of SA‐β‐Gal staining of sections of mouse placentas collected on GD18.5. Quantification of the area of positive signal per mouse (n = 3 mice per group, 3 random fields per mouse). Scale bars, 100 μm. All data are presented as the mean ± SEM. *p < 0.05, **p < 0.01, ***p < 0.001. Mann–Whitney U test. NS, nonsignificant; AU, arbitrary unit. All experiments were performed in triplicate.