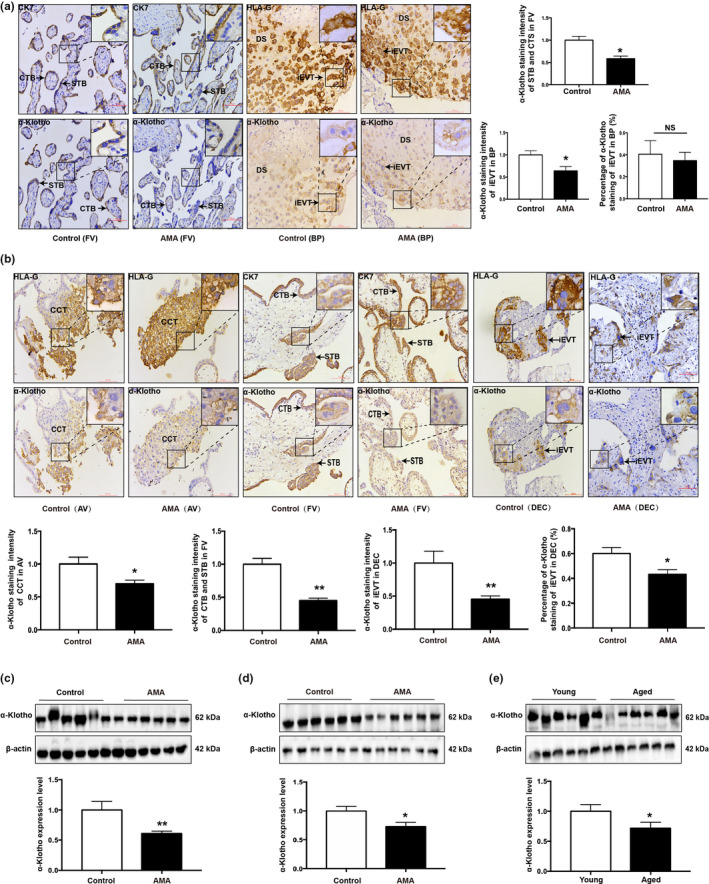
FIGURE 2.

α‐Klotho expression pattern in human and mouse placentas. (a) IHC staining of α‐Klotho in human term placentas; Quantification of staining intensity per patient (n = 3 patients per group, 3 fields per patient); iEVTs and CTBs were identified by HLA‐G and CK7 staining, respectively; DS, decidual side; BP, basal plate; FV, floating villi; STB, syncytiotrophoblasts; iEVT, interstitial extravillous trophoblast; CTBs, cytotrophoblasts; CK7, cytokeratin 7; HLA‐G, human leukocyte antigen G. Scale bars: 100 μm; (b) IHC staining of α‐Klotho in human first trimester villi and decidua; quantification of staining intensity per patient (n = 3 patients per group, 3 fields per patient); AV, anchoring villi; iEVT, interstitial extravillous trophoblast; FV, floating villi; CCT, cell trophoblast; CK7, cytokeratin 7; HLA‐G, human leukocyte antigen G; DEC, decidua. Scale bars, 100 μm; (c) Western blotting of α‐Klotho protein expression in human term placentas, n = 30 in the control and n = 37 in the AMA groups; (d) Western blotting of α‐Klotho in human first trimester villi, n = 6; (e) Western blotting of α‐Klotho protein expression in mouse placentas collected on GD18.5, n = 6. All data are presented as the mean ± SEM. *p < 0.05, **p < 0.01, ***p < 0.001. Mann–Whitney U test. All experiments were performed in triplicate.
