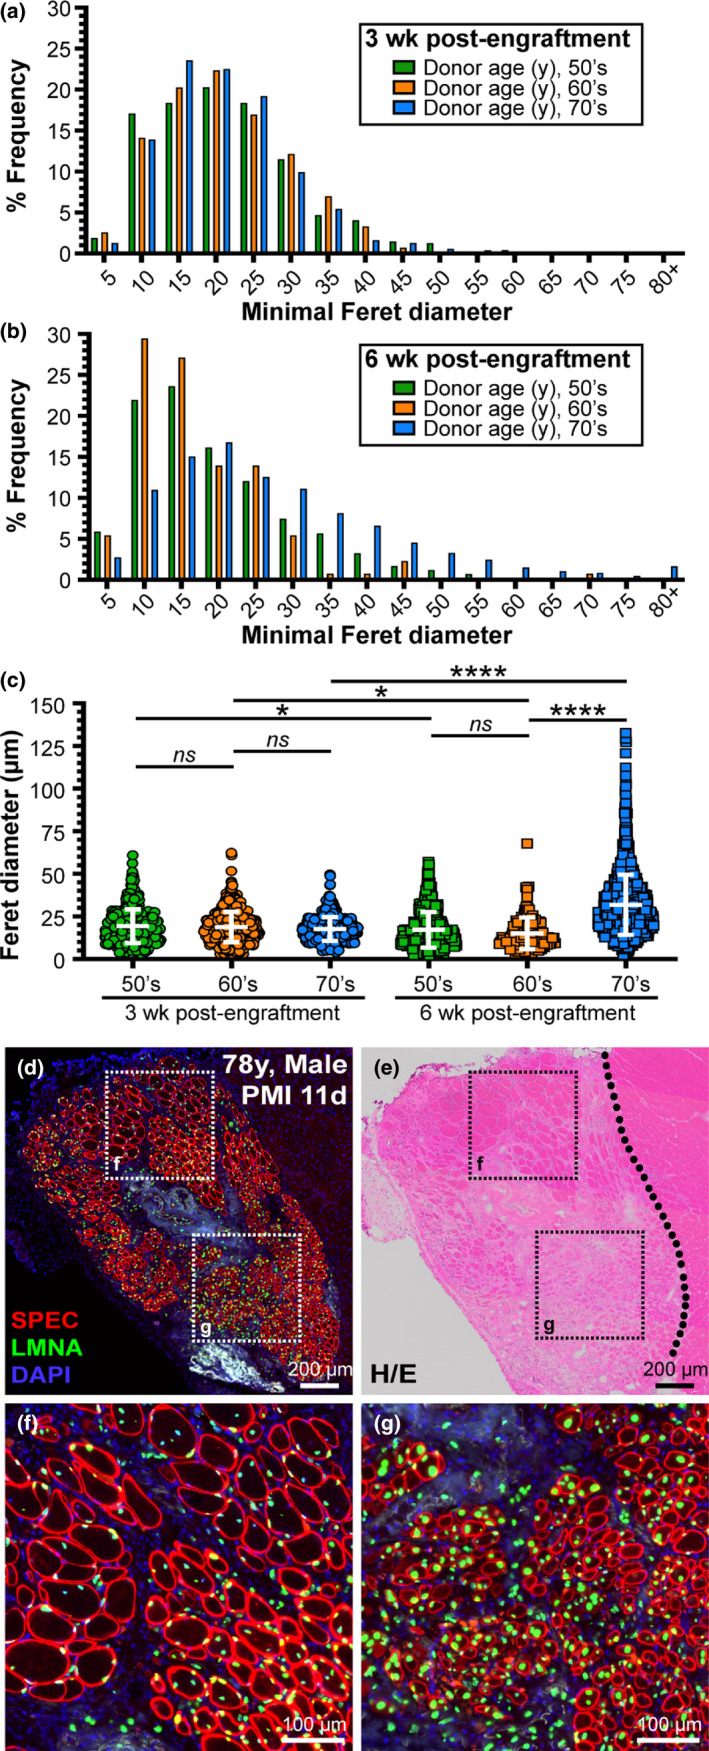
FIGURE 4.

Analysis of muscle fiber growth post‐engraftment. Myofiber diameter data were stratified by age in decades (i.e., 50‐, 60‐, and 70‐year‐old samples). (a) Minimal Feret diameter quantified from samples stratified by age bracket harvested 3 weeks post‐engraftment (50's, n = 2 samples and 468 fibers; 60's, n = 1 sample and 815 fibers; 70's, n = 3 samples and 1884 fibers). (b) Minimal Feret diameter quantified from samples stratified by age bracket harvested 6 weeks post‐engraftment (50's, n = 2 samples and 829 fibers; 60's, n = 1 sample and 130 fibers; 70's, n = 3 samples and 2167 fibers). (c) Scatter‐plot showing mean with SD at both 3‐week and 6‐week post‐engraftment for all cohorts. (d, e) Human skeletal muscle regeneration following postmortem (PMI, 11 days) muscle tissue engraftment from 78‐year‐old human cadaver 6‐week post‐engraftment. Immunostaining for human‐specific spectrin (SPEC, red) and lamin A/C (LMNA, green) proteins (d) indicate the extent of regeneration in this “high‐responder” xenograft, while H/E staining (e) shows the boundary of human muscle regeneration adjacent to the regeneration mouse muscle tissue (delineated by black dotted line). (f, g) Inlays represent areas of mature fibers marked predominantly with peripheral nuclei labeled with human lamin A/C (f) or newly regenerated, centrally nucleated fibers as indicated by the position of lamin A/C‐labeled myonuclei (g). Scale bars represent 200 μm (d, e) and 100 μm (f, g). Statistical analyses performed by one‐way ANOVA with multiple comparisons; ns, not significant, *p < 0.05; ****p < 0.0001.
