FIGURE 1.

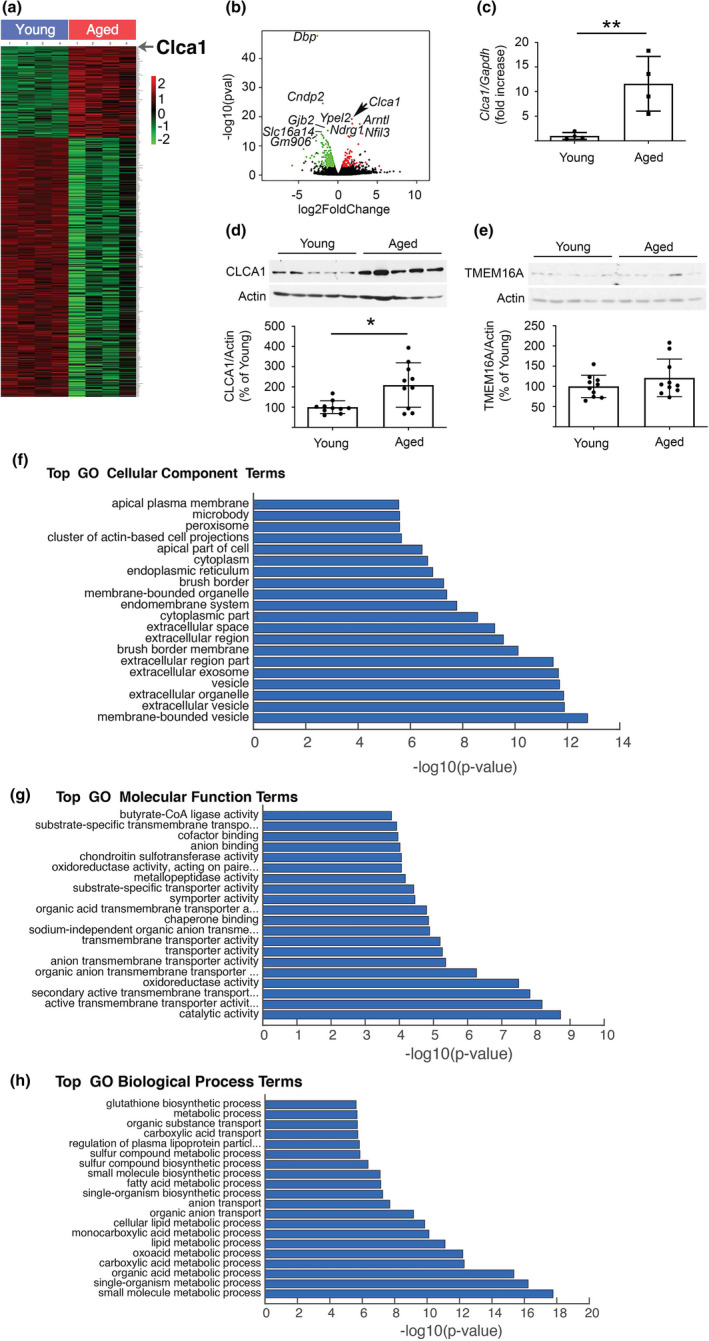
Aging is associated with an increase in kidney CLCA1 expression in mice and humans. (a) HEAT map shows the distribution of kidney mRNAs that were significantly increased (red) or decreased (green) in the aged mice (n = 4) versus young mice (n = 4). The location of CLCA1 is shown. (b) A volcano plot of mRNA changes in renal cortex of young mice and aged mice. CLCA1 expression was increased in the kidneys of aged mice (arrow). (c) RT‐qPCR using specific primers shows an increase in renal cortical CLCA1 mRNA in aged mice (n = 4) versus young mice (n = 4). (d) Immunoblotting shows an increase in CLCA1 protein expression in the renal cortex of aged mice (n = 10) compared to young mice (n = 10). (e) Immunoblotting did not show change in the expression of TMEM16A in kidneys of aged mice (n = 10) versus young mice (n = 10). (f) GO analysis of a cellular component of regulated kidney mRNAs showed the extracellular region part and extracellular space were among the major hits. (g) GO analysis for molecular function revealed anion transmembrane activity and secondary active transmembrane transporter activity among the top hits. (h) GO analysis for the biologic process identified small molecule metabolic process as one of the top findings. (c), (d), (e). Data (mean ± SD) are shown in bars with scatter plots, and were analyzed by t test. *p < 0.05, **p < 0.01
