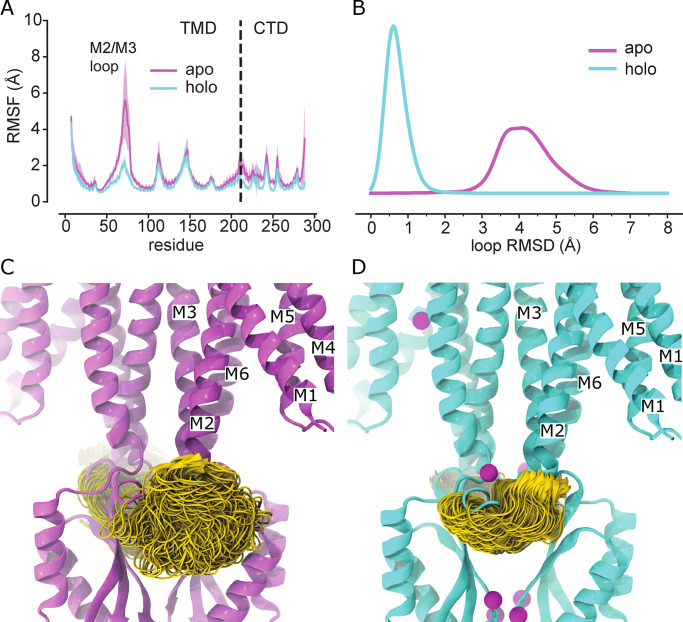
Figure 5.
MD simulations show greater flexibility of the M2/M3 loop in the apo state. (A) RMSFs calculated for each YiiP monomer for all of the MD simulations in apo state (purple) and the holo state (cyan). RMSFs for residues in the TMD or CTD, indicated by the dashed line, were calculated after superposition on the corresponding domain. RMSF profiles were averaged over the two protomers and over the three independent simulations, with the error bands indicating the SD for these six profiles. (B) Cα RMSD distributions (KDE) for the M2/M3 loop residues after superposition on the loop from the starting model (PDB accession no. 5VRF). (C) M2/M3 loop (gold) conformations for the apo simulation md1, protomer B. The image depicts 1,000 frames from the trajectory taken at 1-ns intervals with individual frames superimposed on the Cα atoms of the TMD. The Zn-free 5VRF structure is shown in purple. (D) M2/M3 loop (gold) conformations for the holo simulation md1, protomer B (as in C); 5VRF starting conformation shown in cyan with Zn ions in magenta.

