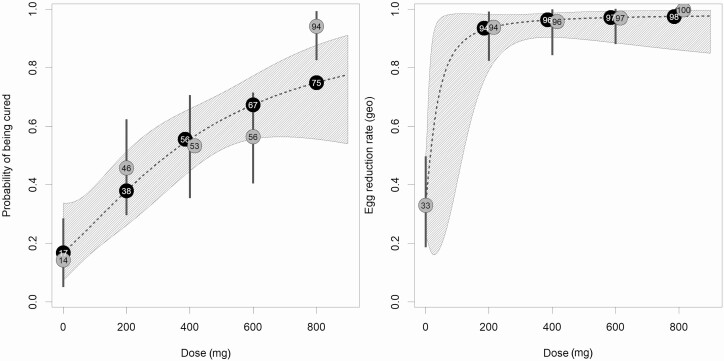
Figure 2.
Cure rates (CRs) and egg reduction rates (ERRs) of albendazole in adults predicted by the hyperbolic Emax model. Dotted lines represent the dose-response curve, and the hatched area corresponds to the 95% confidence band. White numbers present the predicted CRs and ERRs for the investigated doses. Gray circles with black numbers represent the observed dose group CRs, and the gray vertical lines correspond to the 95% confidence intervals. Abbreviation: geo, geometric.

