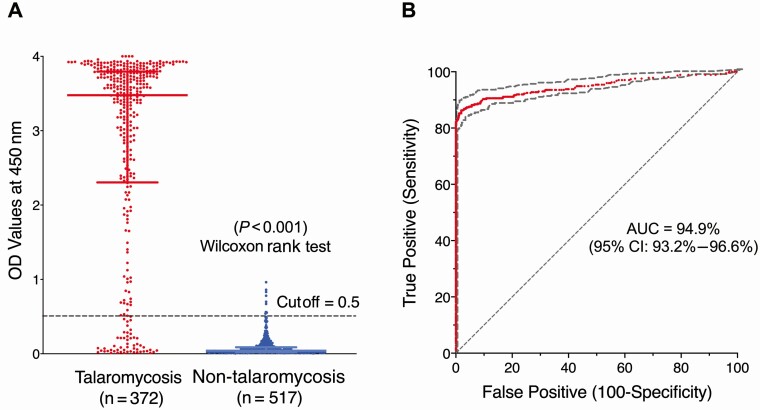
Figure 2.
A, Optical density (OD) distribution of talaromycosis cases and non-talaromycosis controls; the difference in OD distribution was statistically significant. B, Receiver operating characteristic (ROC) curve demonstrated excellent discrimination (94.9% accuracy) between talaromycosis cases and non-talaromycosis controls. The OD cutoff of 0.5 was the Youden index calculated from the ROC curve, which maximizes true positives, minimizes false positives, and assumes equal importance of sensitivity and specificity. Abbreviations: AUC, area under the receiver operating characteristic curve; CI, confidence interval; OD, optical density.

