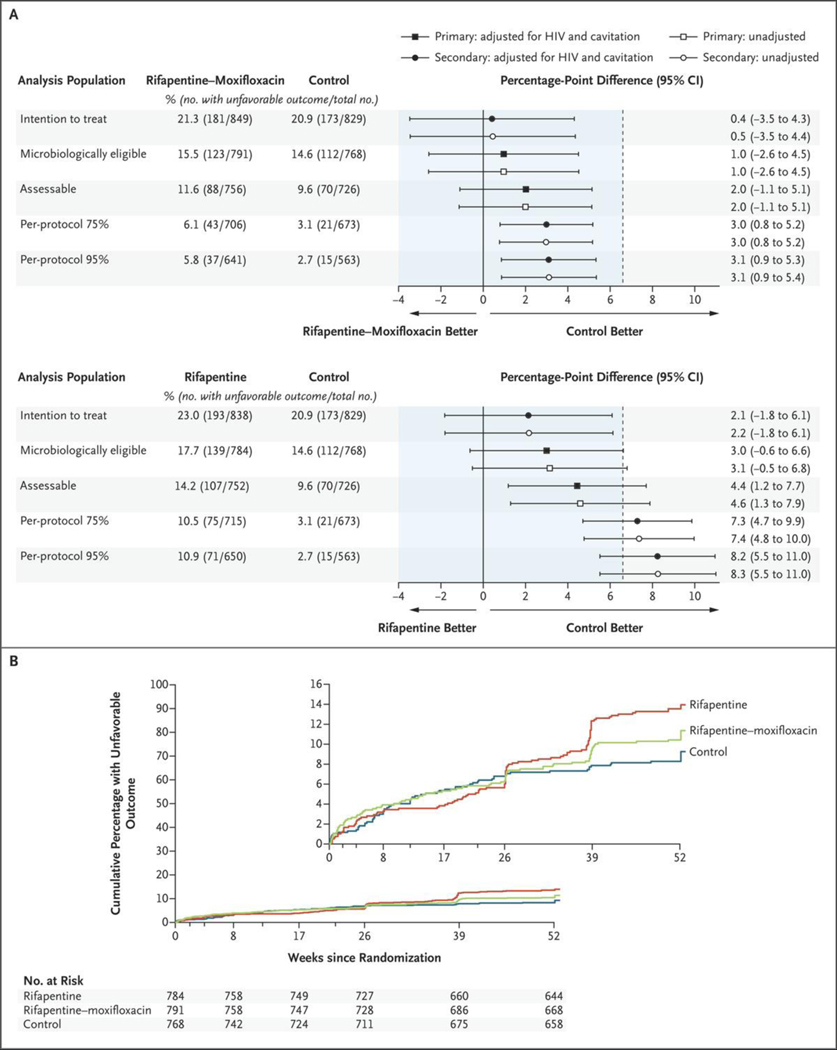
Figure 2. Primary and Secondary Efficacy Analyses and Time to an Unfavorable Outcome.
Panel A shows the results of the primary efficacy analysis in the microbiologically eligible and the assessable analysis populations and of the secondary analyses in the intention-to-treat and the per-protocol analysis populations (top, rifapentine–moxifloxacin regimen vs. control regimen; bottom, rifapentine regimen vs. control regimen). The noninferiority margin of 6.6 percentage points is designated by the dashed vertical line. Participants were classified as having an unfavorable outcome if they had M. tuberculosis–positive cultures from two sputum specimens obtained at or after week 17 without an intervening negative culture, died or were withdrawn from the trial or lost to follow-up during the treatment period, had an M. tuberculosis–positive culture when last seen, died from tuberculosis during the post-treatment follow-up, or received additional treatment for tuberculosis. The microbiologically eligible analysis population included all the participants except those who had no evidence of M. tuberculosis–positive cultures, who had tuberculosis that was resistant to isoniazid, rifampin, or fluoroquinolones, or who were enrolled in violation of the eligibility criteria; the participants with an outcome status that was not assessable were reclassified as having had an unfavorable outcome. The assessable analysis population included the participants in the microbiologically eligible population except those whose outcome status had been reclassified from not assessable to unfavorable. The per-protocol 75% and per-protocol 95% analysis populations included the participants in the assessable population, except those who did not complete 75% or 95% of the assigned treatment doses, respectively, unless the reason for inadequate treatment was death or bacteriologic treatment failure. Panel B shows the results for the time to unfavorable outcome for the microbiologically eligible population. Data were censored for the participants who could not be assessed. HIV denotes human immunodeficiency virus. The inset shows the same data on an expanded y axis.

