Figure 1. HBV GP fusion trigger is independent of acidic pH, HSPG, and NTCP.
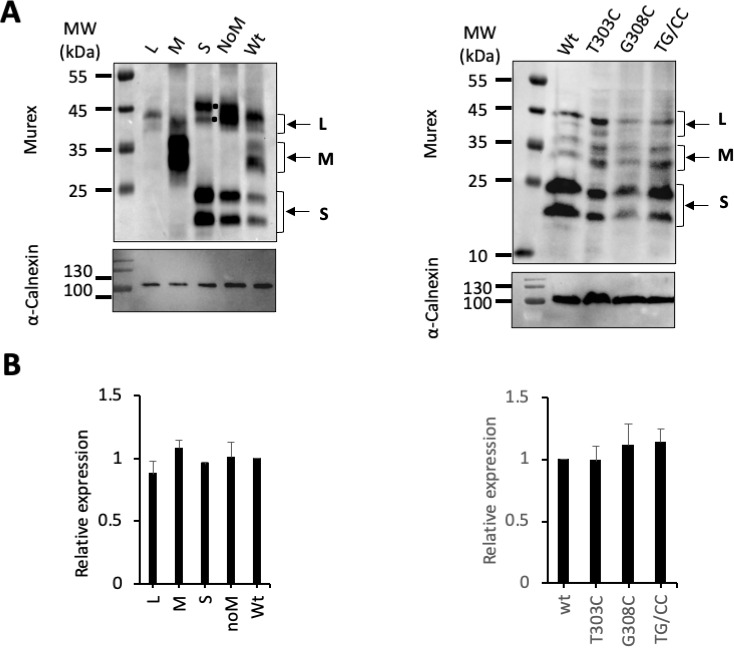
(A) Huh7 ‘donor’ cells transfected with the pT7HB2.7 plasmid allowing expression of hepatitis B virus glycoproteins (HBV GPs) (HBV) and a luciferase marker gene driven by the HIV-1 promoter were co-cultured with either Huh7-tat (H-tat) or Huh7-NTCP-tat (N-tat) ‘indicator’ cells that express the HIV Tat protein. After 24 hr of co-culture, the cells were treated at pH 4 (or pH 5 for VSV-G) vs pH 7 for 3 min. The luciferase activity induced by fusion between donor and indicator cells was then measured 24 hr later. A control plasmid that does not allow GP expression (Empty) was used to determine the background of luciferase expression. The Crimean-Congo hemorrhagic fever virus (CCHFV) Gn/Gc (CCHFV) or vesicular stomatitis virus-G (VSV-G) (VSV) GPs were used as positive controls for fusion at low pH. Fusion mediated by HBV GPs with Huh7-tat cells was taken as 100%. The bars represent the means (N = 3). Error bars correspond to standard deviation. See the raw data of individual experiments in Figure 1—figure supplement 1. (B) Results of cell-cell fusion assays performed as described above in the presence of heparin at the indicated concentrations throughout the co-culture. No cytotoxicity could be detected in these conditions (Figure 1—figure supplement 2). The graphs represent the average of two independent experiments. Fusion mediated by HBV GPs with mock-treated Huh7 cells was taken as 100%. (C) CHO ‘donor’ cells transfected with the pT7HB2.7 plasmid and a luciferase marker gene driven by the HIV-1 promoter were co-cultured with either Huh7-tat (H-tat), CHO-tat (CHO wild-type [wt]), or CHO-pgsB618-tat (pgsB618) ‘indicator’ cells that express the HIV Tat protein. The luciferase activity induced by fusion between donor and indicator cells was then measured 24 hr later. A control plasmid that does not allow GP expression (Empty) was used to determine the background of luciferase expression. Fusion mediated by HBV GPs with Huh7-tat was taken as 100%. The graphs represent the average of two independent experiments. (D) Huh7 ‘donor’ cells transfected with plasmids allowing expression of L, M, or S HBV GPs alone, both L and S GPs (noM), or all HBV GPs (Wt) and a luciferase marker gene driven by the HIV-1 promoter were co-cultured with Huh7-tat or Huh7-NTCP-tat ‘indicator’ cells that express HIV Tat protein. Cell co-cultures were then processed as described above to determine cell-cell fusion activity. Fusion mediated by HBV GP at pH 7 with Huh7-tat cells was taken as 100%. The bars represent the means (N = 3). Error bars correspond to standard deviation. (E) Detection of HBV GPs at the cell surface by biotinylation. Transfected Huh7 cells were biotinylated for 30 min at 4°C and then processed biochemically. Cell lysates were subjected to streptavidin pull-down prior to western blot analysis using anti-HBsAg antibody (Murex). The molecular weight markers (kDa) are shown on the right. Calnexin detection was used as control for the cytoplasmic protein marker, showing the integrity of cell membrane, as shown in this representative western blot. (F) Relative GP expression at the cell surface as compared to Wt, quantified by adding the L+M+S signals from western blot analyses. The results are expressed as mean ± SD (N = 3). No statistical differences could be found using the Mann-Whitney test (p-value>0.05). See also the quantification of total HBV GP expression in Figure 1—figure supplement 4.
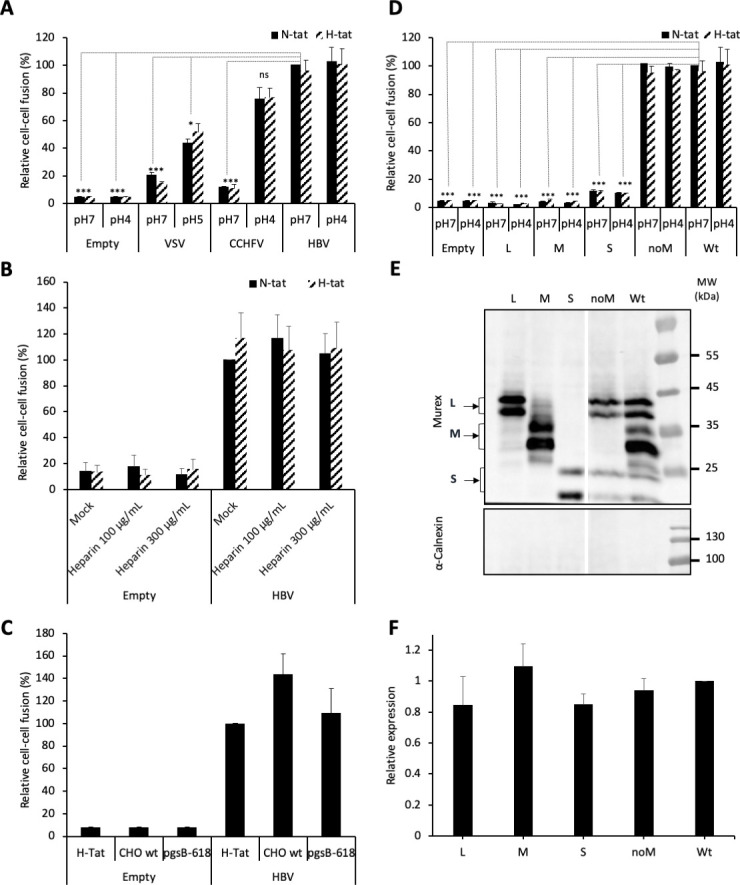
Figure 1—figure supplement 1. HBV GP fusion trigger is independent of acidic pH and NTCP.

Figure 1—figure supplement 2. Results of cell survival after drug treatments.

Figure 1—figure supplement 3. Characterization of ‘noM’ HDV particles.

Figure 1—figure supplement 4. Total protein expression.