. 2021 Jun 30;10:e64507. doi: 10.7554/eLife.64507

Figure 2. Functional analysis of predicted HBV fusion peptides.

(A) Sequence of hepatitis B virus (HBV) L protein showing the amino acid color code and boxes for the localization of the two predicted fusion peptides in preS1 and in preS2. (B) Sequences of the two predicted fusion peptides showing the positions that were mutated (bold). (C, D) Huh7 cells were co-transfected with pSVLD3 plasmid coding for hepatitis delta virus (HDV) RNPs and plasmids coding for wild-type (wt) or mutant HBV glycoproteins (GPs). The FW/AA and FW/EE are double-alanine mutants at positions F52 and W66. As control, pSVLD3 was co-transfected with an empty plasmid (referred to as ‘noGP’). At day 9 post-transfection, the cell supernatants were harvested and filtered, and the extracellular RNA was extracted and purified before quantifying HDV RNAs by quantitative reverse transcription PCR (RTqPCR). HDV RNA levels in GE (genome equivalent) are expressed as means ± SD (N = 3) per ml of cell supernatants. (E, F) HDV particles were used to infect Huh7-NTCP cells, which were grown for 7 days before total intracellular RNA was purified. The results of HDV RNA quantification by RTqPCR are expressed after normalization with glyceraldehyde 3-phosphate dehydrogenase (GAPDH) RNAs as means ± SD (N = 3) per ml of cell lysates containing 106 cells. (G, H) Huh7 ‘donor’ cells co-expressing wt or mutant HBV GPs and a luciferase marker gene driven by the HIV-1 promoter were co-cultured with either Huh7-tat (H-tat) or Huh7-NTCP-tat (N-tat) ‘indicator’ cells that express HIV Tat protein. After 24 hr, the cells were treated at pH 4 or pH 7 for 3 min. The luciferase activity induced by the fusion between the donor and indicator cells was measured 24 hr later. Fusion mediated by wt GP at pH 7 with Huh7-NTCP-tat cells was taken as 100%. The bars represent the means (N = 5). Error bars correspond to standard deviations. (I, J) Quantification of wt and mutant GPs at cell surface by western blot analyses (see examples in Figure 2—figure supplement 2). The results show the relative GP expression of preS1 (I) and preS2 (J) mutants compared to Wt, as indicated, and are expressed as means ± SD (N = 3). No statistical differences could be found using the Mann-Whitney test (p-value>0.05).
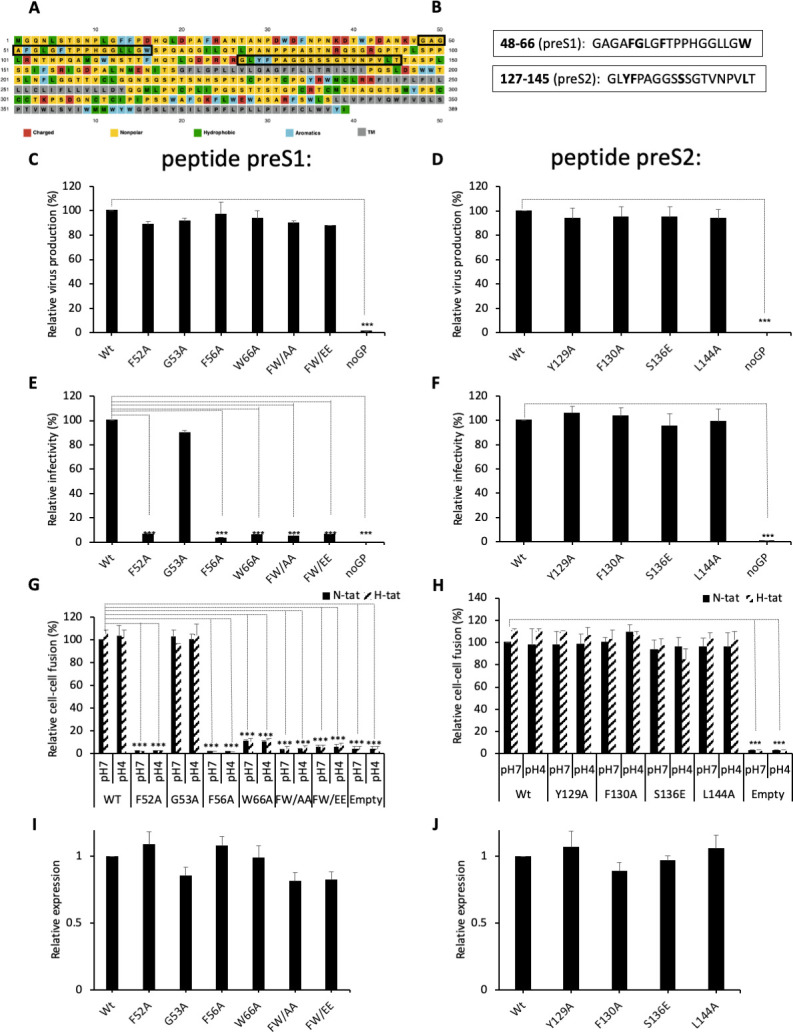
Figure 2—source data 1. Functional analysis of predicted HBV fusion peptides.
The values correspond to the data expressed in the graphs displayed in Figure 2C, D, E, F, I and J.
Figure 2—source data 2. Functional analysis of predicted HBV fusion peptides.
The values correspond to the data expressed in the graphs displayed in Figure 2G.
Figure 2—source data 3. Functional analysis of predicted HBV fusion peptides.
The values correspond to the data expressed in the graphs displayed in Figure 2H.

Figure 2.

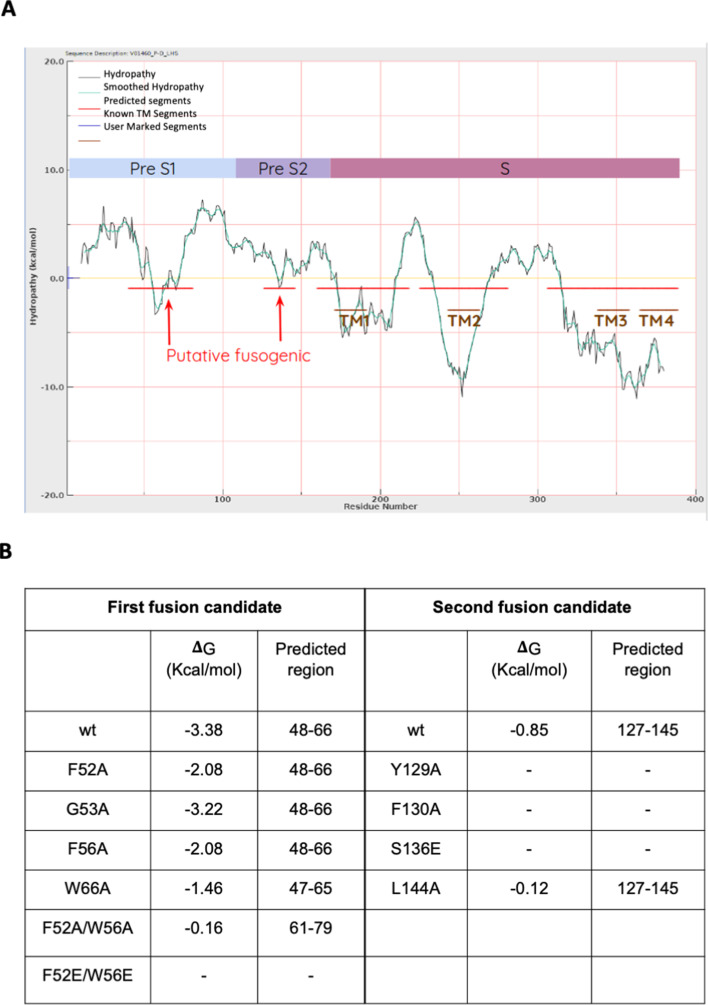
Figure 2—figure supplement 1. Prediction of fusion peptides within S protein by using Wimley-White interfacial hydrophobicity scale.

Figure 2—figure supplement 1.

(A) The hydropathy profile (black curve) and its smoothed approximation (green curve). The interface scale measures a residue’s free energy of transfer within an unfolded polypeptide chain, from water to a phosphocholine bilayer. The five predicted regions with high propensity to interact with the lipid surface of the cell membrane are indicated with horizontal red bars, and the four putative transmembrane regions are indicated with horizontal brown bars. The two regions indicated with red arrows were considered as putative fusogenic peptides. The preS1, preS2, and S regions are represented above the curve. (B) Impact of mutations in predicted putative fusogenic segments. The table reports the Gibbs free energy (ΔG) of the two presumed fusogenic segments computed for wild-type (wt) and mutants. A negative ΔG indicates that a peptide is favored for partitioning from water to lipid bilayer, so it may be suspected as fusogenic. A dash indicates that the region is no longer expected to interact with the lipid bilayer and hence is fusogenic.
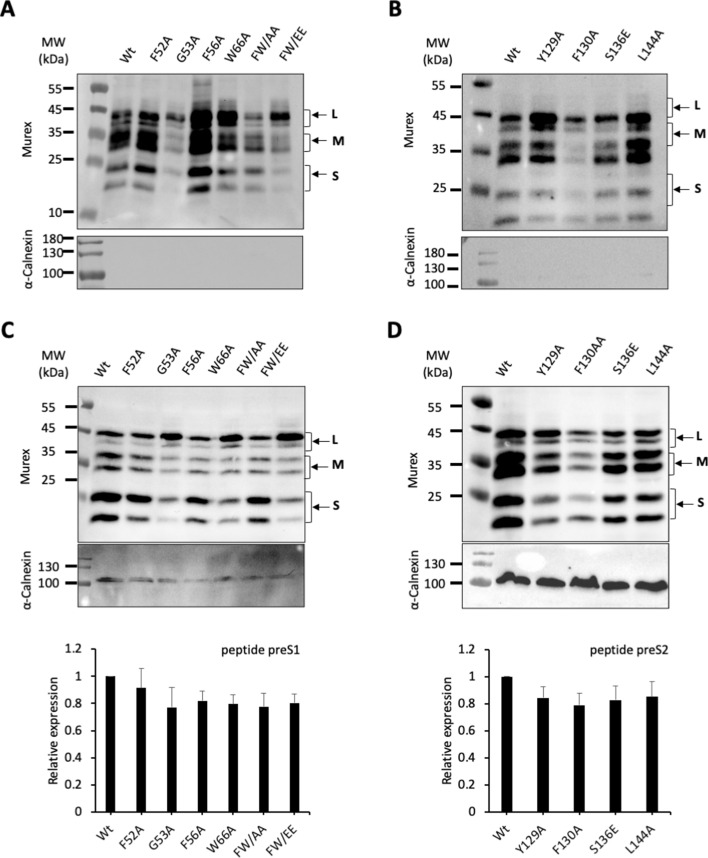
Figure 2—figure supplement 2. Cell-surface and intracellular detection of preS1 and preS2 HBV GP mutants.

Figure 2—figure supplement 2.

(A, B) Huh7 cells expressing wild-type (wt) or mutant hepatitis B virus glycoproteins (HBV GPs) from Figure 2 were biotinylated for 30 min at 4°C and then processed biochemically. Cell lysates were subjected to streptavidin pull-down prior to western blot analysis using anti-HBsAg antibody (Murex). The molecular weight markers (kDa) are shown on the left. Calnexin detection was used as control for the cytoplasm protein marker, showing the integrity of the cell membrane. (C, D) Detection and quantification of total GP expression. Cell lysates of Huh7 cells expressing the indicated wt or mutant GPs from Figure 2 were subjected to western blot analysis using anti-HBsAg antibody (Murex). The molecular weight markers (kDa) are shown on the left. Calnexin detection was used as control for the cytoplasmic protein marker, as shown in these representative western blots. The results show the relative GP expression compared to Wt of preS1 (C) and preS2 mutants (D), as indicated, and are expressed as mean ± SD (N = 3).