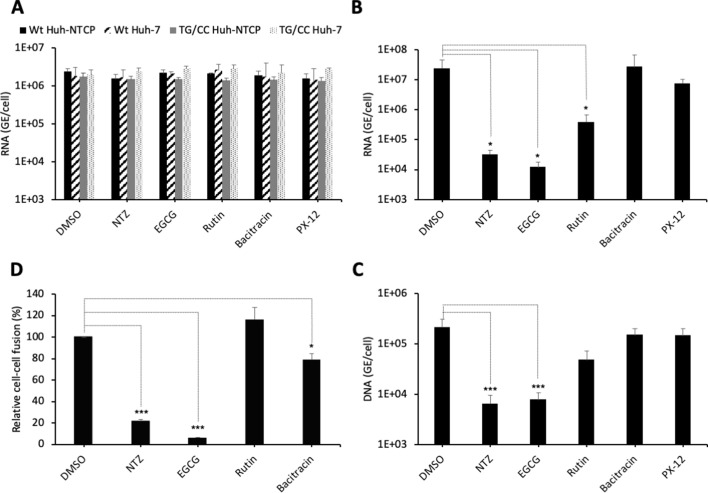
Figure 6. PDI inhibitors in HBV entry.
(A) Hepatitis delta virus (HDV) particles harboring wild-type (wt) or TG/CC mutant (T330C/G308C) hepatitis B virus glycoproteins (HBV GPs) were incubated with Huh7 or Huh7-NTCP cells that were pre-treated for 2 hr with the indicated inhibitors that block different protein disulfide isomerase (PDI) proteins or with dimethyl sulfoxide (DMSO), used as the vehicle. Binding of either virus particles to the cells was quantified by quantitative reverse transcription PCR (RTqPCR) and expressed after normalization with glyceraldehyde 3-phosphate dehydrogenase (GAPDH) RNAs as mean ± SD (N = 3) per ml of cell lysates containing 106 cells. (B) HDV or (C) HBV particles were used to infect Huh7-NTCP cells that were pre-incubated for 2 hr with the indicated inhibitors that block different PDI proteins or with DMSO, used as a vehicle. Infected cells were grown for 7 days before the total intracellular RNA or DNA was purified. The results of HDV RNA and HBV DNA quantification by RTqPCR and quantitative PCR (qPCR), respectively, are expressed after normalization with GAPDH RNAs as means ± SD (N = 3) per ml of cell lysates containing 106 cells. (D) Huh7 ‘donor’ cells co-expressing HBV GPs and a luciferase marker gene driven by the HIV-1 promoter were co-cultured with Huh7-NTCP-tat ‘indicator’ cells that express HIV Tat protein. The indicated PDI inhibitors were added when ‘donor’ and ‘indicator’ cells were mixed for co-cultures and the luciferase activity induced by cell-cell fusion was measured 24 hr later. DMSO was used as a vehicle. Fusion mediated by HBV GPs without inhibitor was taken as 100%. The graphs represent the average of four independent experiments. The PDI inhibitors were used at the following concentrations: nitazoxanide (NTZ), 30 µg/ml; (−)-epigallocatechin 3-gallate (EGCG), 5 µM; rutin, 5 µM; bacitracin, 5 mM; PX-12, 30 µg/ml. No cytotoxicity could be detected in these conditions (Figure 1—figure supplement 2).

