. 2021 Jun 18;10:e63852. doi: 10.7554/eLife.63852

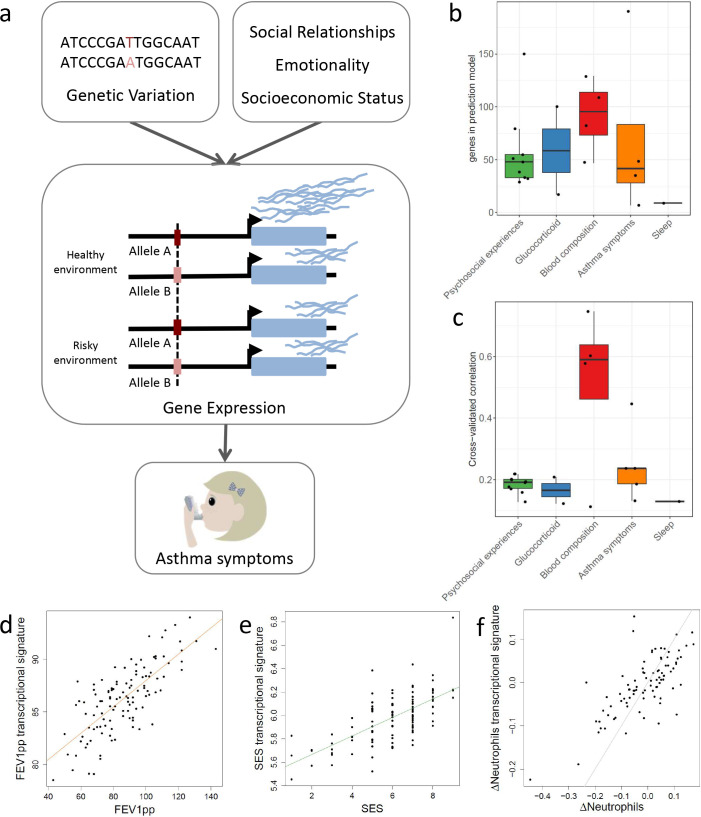
Figure 1. Transcriptional signatures of psychosocial experiences and asthma symptoms.

(a) Central hypothesis. (b) Number of genes in elastic net regression models that explain at least 1% of variance. Colors represent different categories of variables. (c) Pearson’s correlations between cross-validated transcriptional signatures and measured variables for elastic net regression models that explain at least 1% of variance. (d) Forced expiratory volume in one second [FEV1] percent predicted transcriptional signature model fit (Pearson’s rho = 0.76, p<0.001). (e) MacArthur socioeconomic status transcriptional signature model fit (Pearson’s rho = 0.67, p<0.001). (f) Longitudinal change in observed neutrophils (x axis) and longitudinal change in transcriptional signature of neutrophils (y axis) (Pearson’s rho = 0.72, p<0.001, gray = identity line).

Figure 1—source data 1. GLMnet model weights for the transcriptional signatures.
The transcriptional signatures are in columns, while the genes are in rows.

Figure 1.

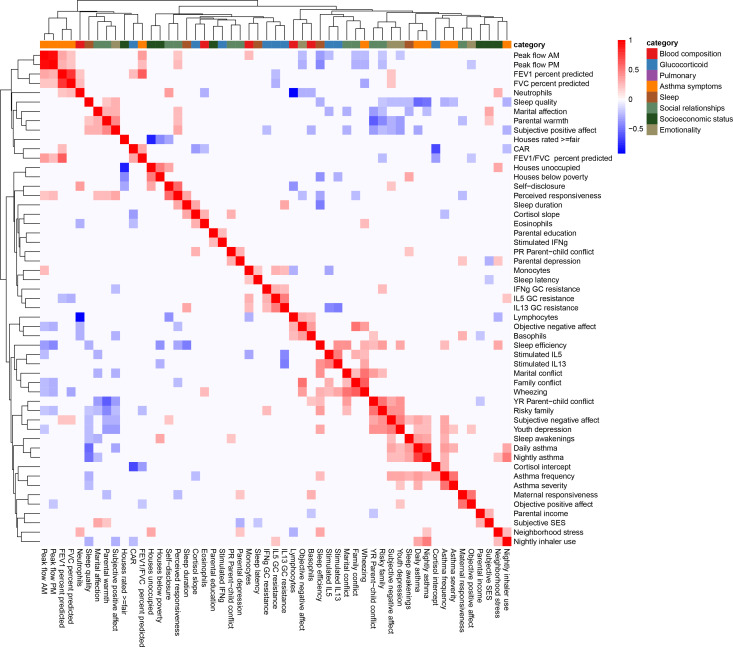
Figure 1—figure supplement 1. Clustered heatmap of (Pearson) correlations between all variables used in the study.

Figure 1—figure supplement 1.

Color indicates the strength and direction of correlation; white indicates p-value>0.05. Hierarchical clustering is represented on the top and side of the heatmap. Variables are grouped by colors indicating the different categories considered.

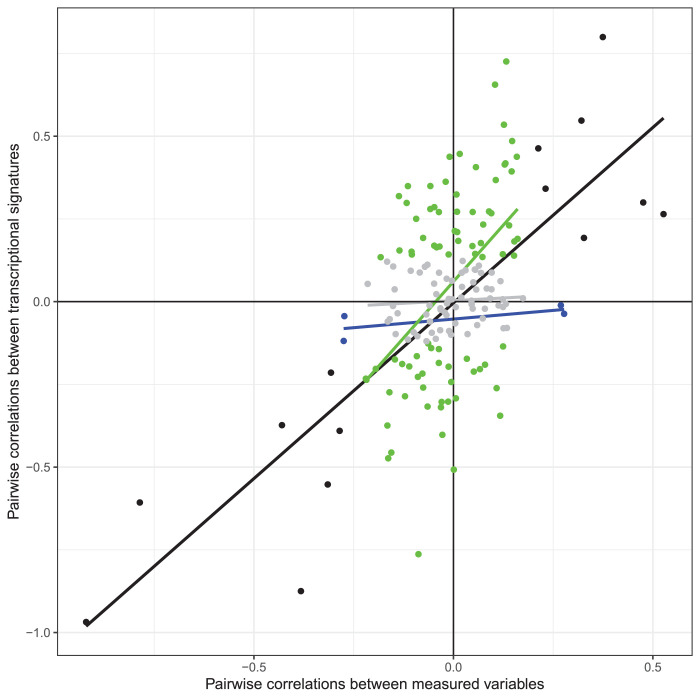
Figure 1—figure supplement 2. Scatterplot of Pearson's correlation coefficients between each pair of observed variables (x axis) and metagenes (y axis) for the 19 variables with transcriptional signatures explaining >1% of observed variance.

Figure 1—figure supplement 2.

Color represents significance of the correlation (gray: nonsignificant correlations in observed variables or metagenes; blue: significant correlation between observed variables only; green: significant correlation between transcriptional signatures only; black: correlation significant in both observed variables and metagenes).

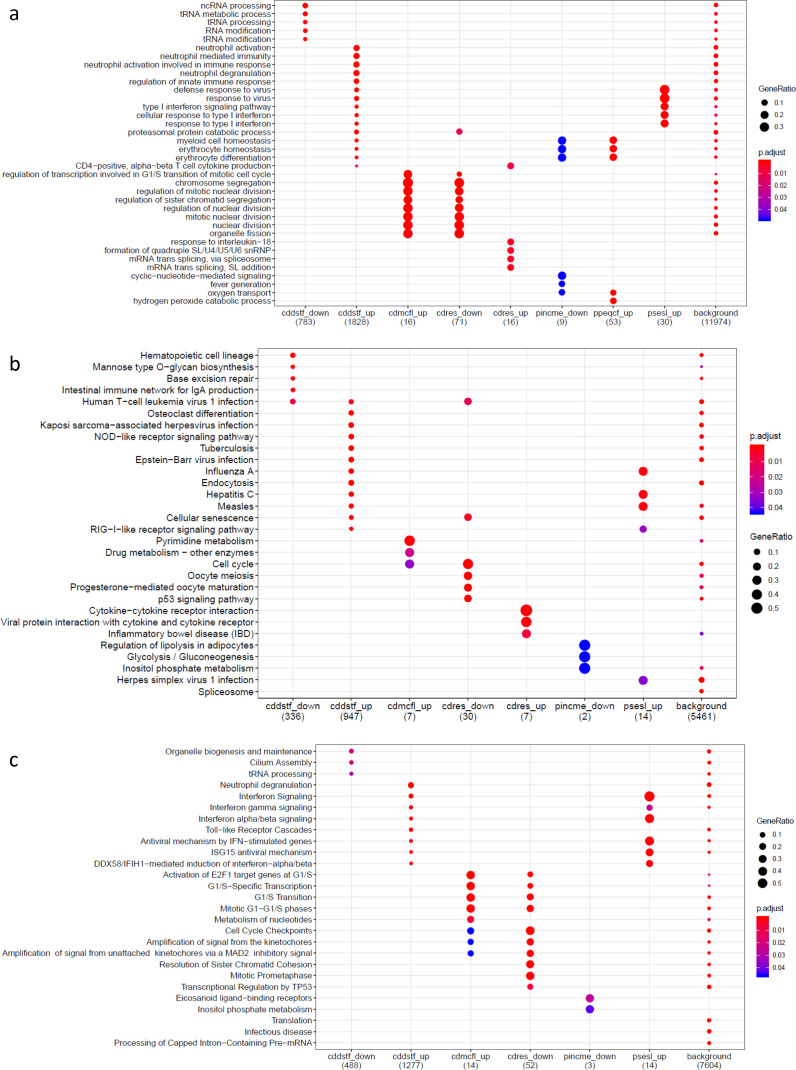
Figure 1—figure supplement 3. Gene set enrichment analysis results on genes differentially expressed for psychosocial experiences.

Figure 1—figure supplement 3.

(a) Gene Ontology, (b) Kyoto Encyclopedia of Genes and Genomes, and (c) Reactome Pathway Database. Variable symbols: cddstf: self-disclosure; cdmcfl: child-reported conflict with mother; cdres: perceived responsiveness; pincme: parent’s income; ppeqcf: parent-reported conflict with child; psesl: subjective socioeconomic status. Down denotes downregulated genes, up denotes upregulated genes.

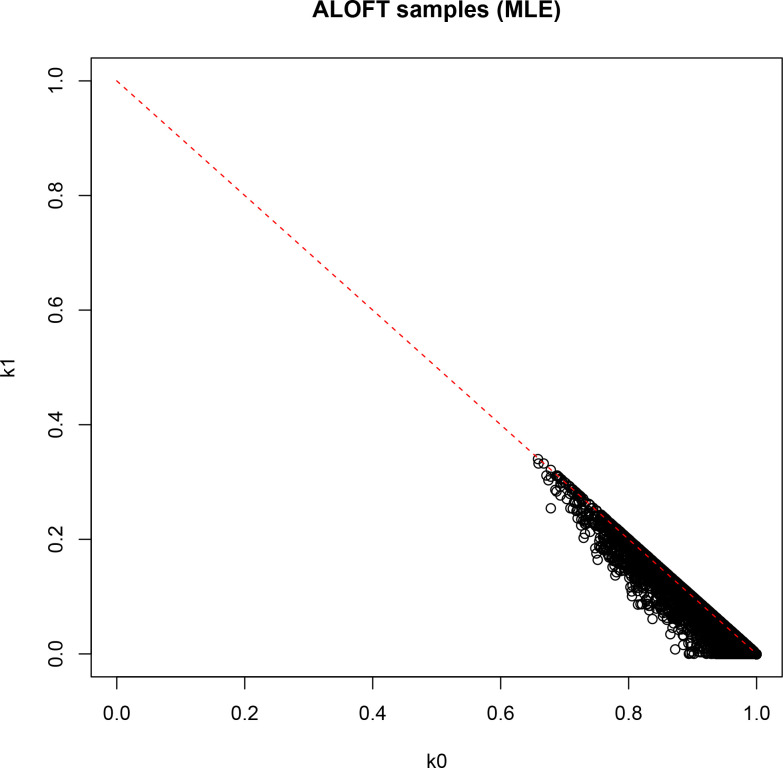
Figure 1—figure supplement 4. Result of identity-by-descent analysis (IBD; maximum likelihood estimation [MLE]) on DNA-derived genotypes for all 251 participants.

Figure 1—figure supplement 4.

k0: probability of sharing zero alleles IBD; k1: probability of sharing one allele IBD.

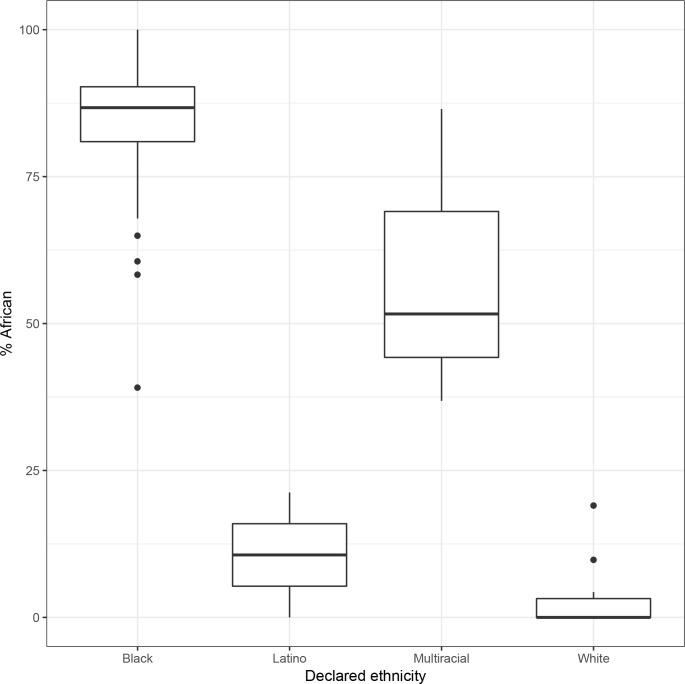
Figure 1—figure supplement 5. Self-reported ethnicity (x axis) vs. percent global African ancestry (y axis) in 119 participants for whom declared ethnicity is available.

Figure 1—figure supplement 5.

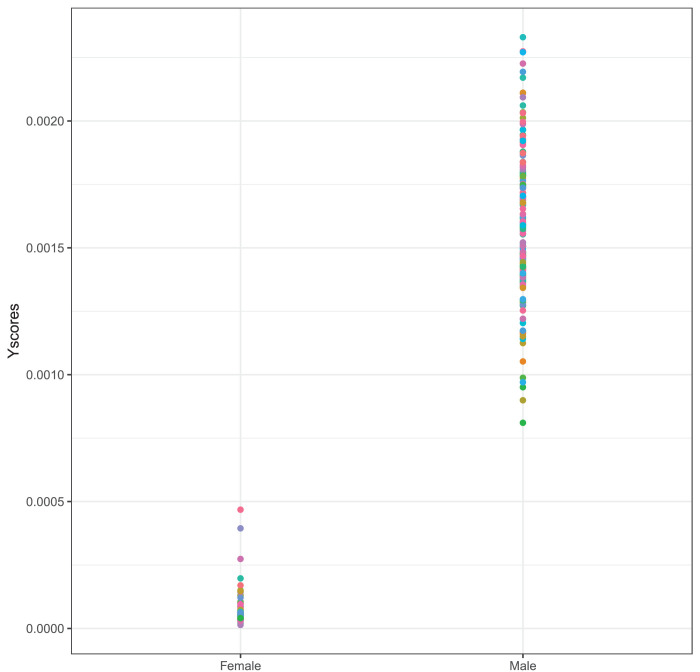
Figure 1—figure supplement 6. Proportion of reads mapping to the Y chromosome over all mapped reads separately for self-reported females and males.

Figure 1—figure supplement 6.

Each dot is one sample.

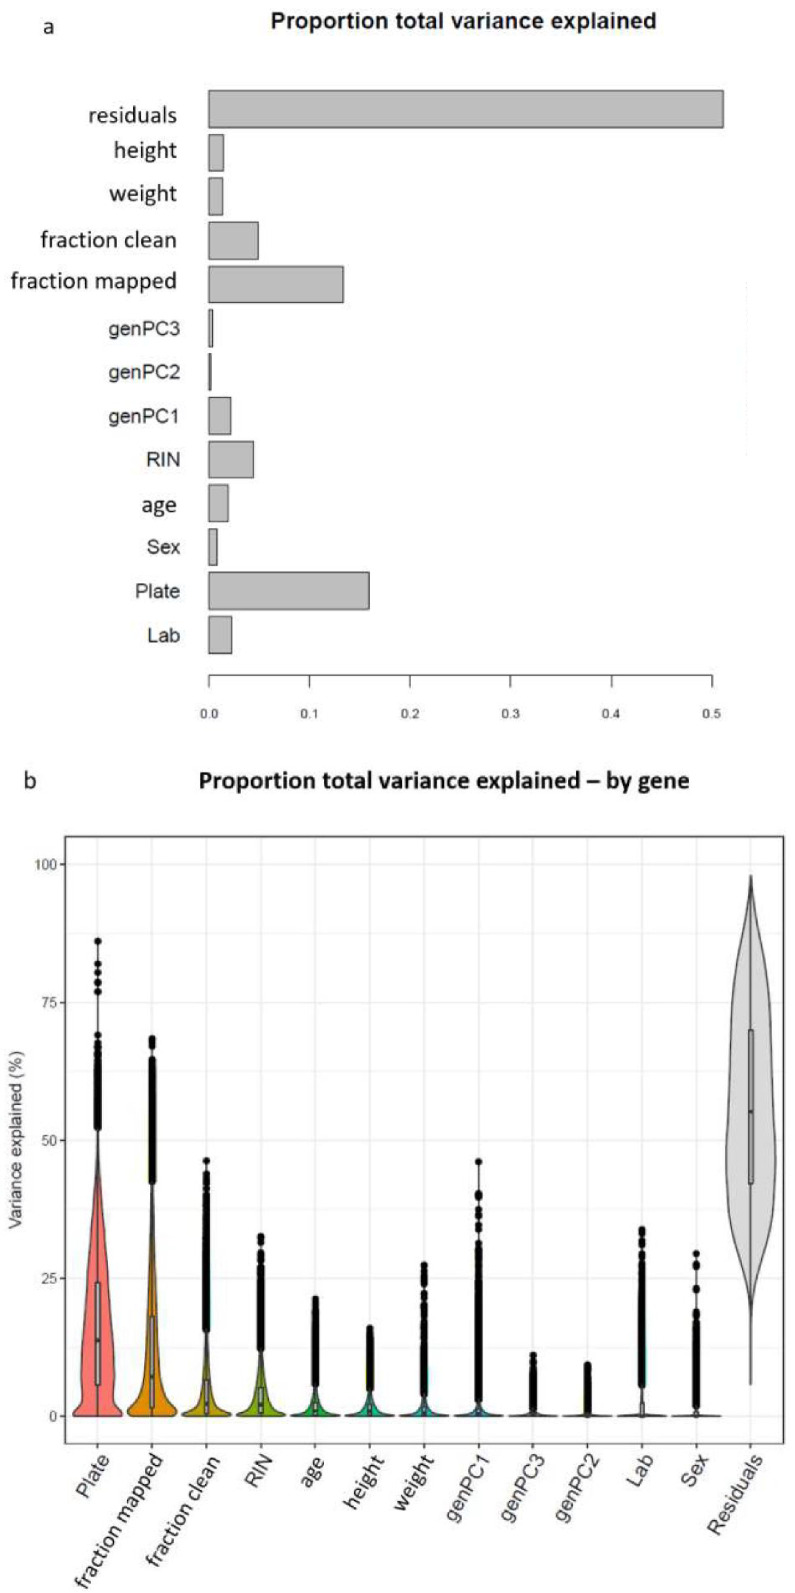
Figure 1—figure supplement 7. Sources of variation in gene expression data.

Figure 1—figure supplement 7.

(a) Proportion of global variance in gene expression explained by each covariate tested within a single linear model. (b) Proportion of variance explained by each covariate for each analyzed gene.

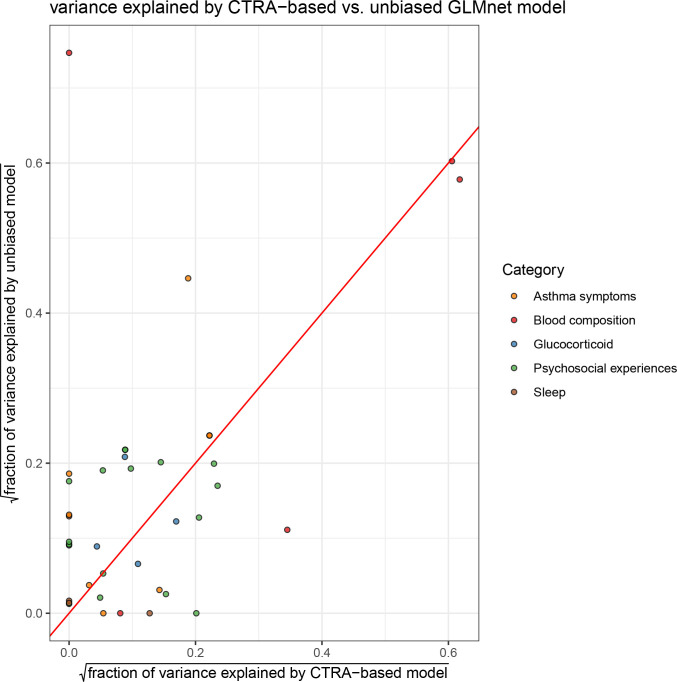
Figure 1—figure supplement 8. Comparison of variance explained by conserved transcriptional response to adversity (CTRA)-based (x axis) and unbiased (y axis) elastic net prediction models; color indicates type of variable (red = identity line).

Figure 1—figure supplement 8.