. 2021 Jun 18;10:e63852. doi: 10.7554/eLife.63852

Figure 2. Correlation among psychosocial and clinical transcriptional signatures.

Heatmap of Pearson’s correlations between transcriptional signatures explaining at least 1% of variance. Heatmap color indicates strength and direction of correlation; white indicates p-value>0.05. Hierarchical clustering of variables is represented above the heatmap, with colors indicating categories for each variable as indicated in the legend.

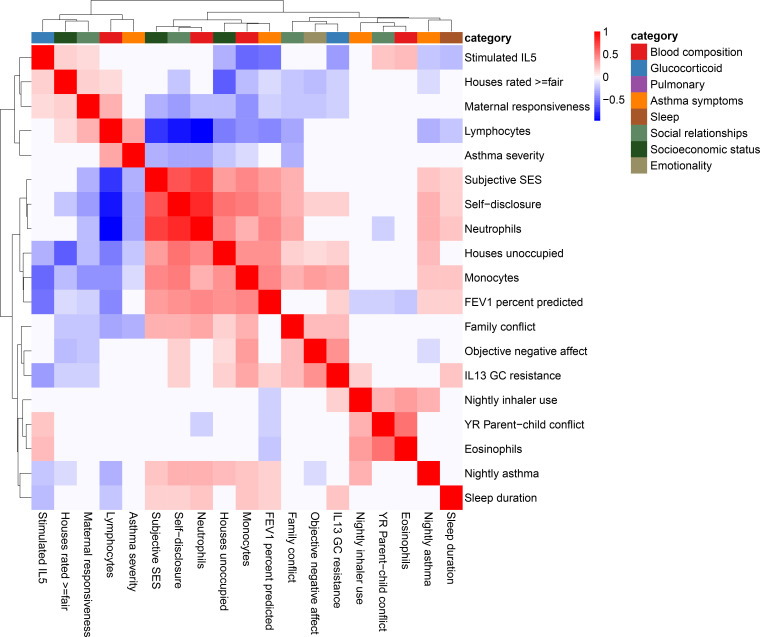
Figure 2.

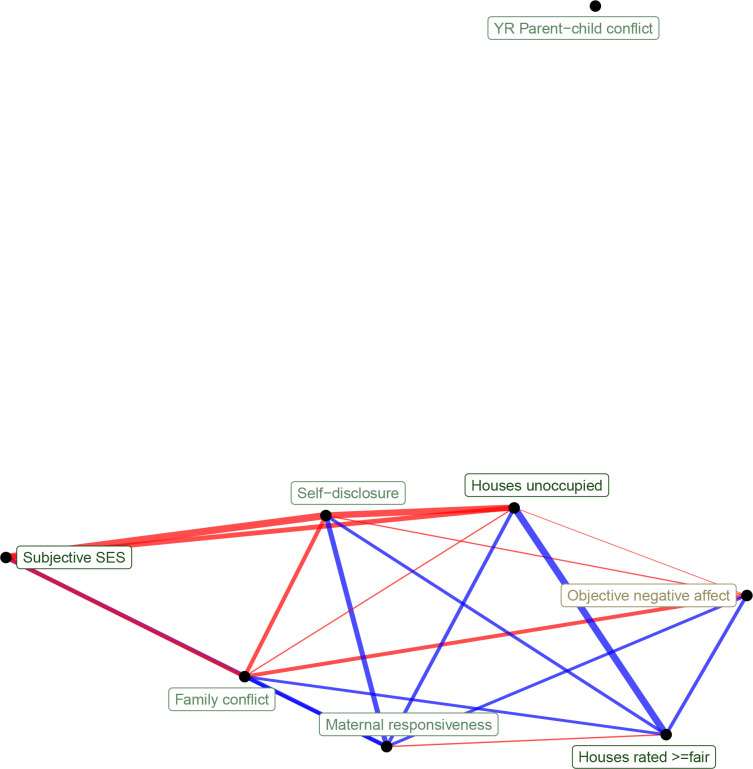
Figure 2—figure supplement 1. Network representation of correlations between transcriptional signatures of psychosocial experiences (edge width reflects absolute value of Pearson's correlation score, edge color reflects positive [red] or negative [blue] correlation).

Figure 2—figure supplement 1.

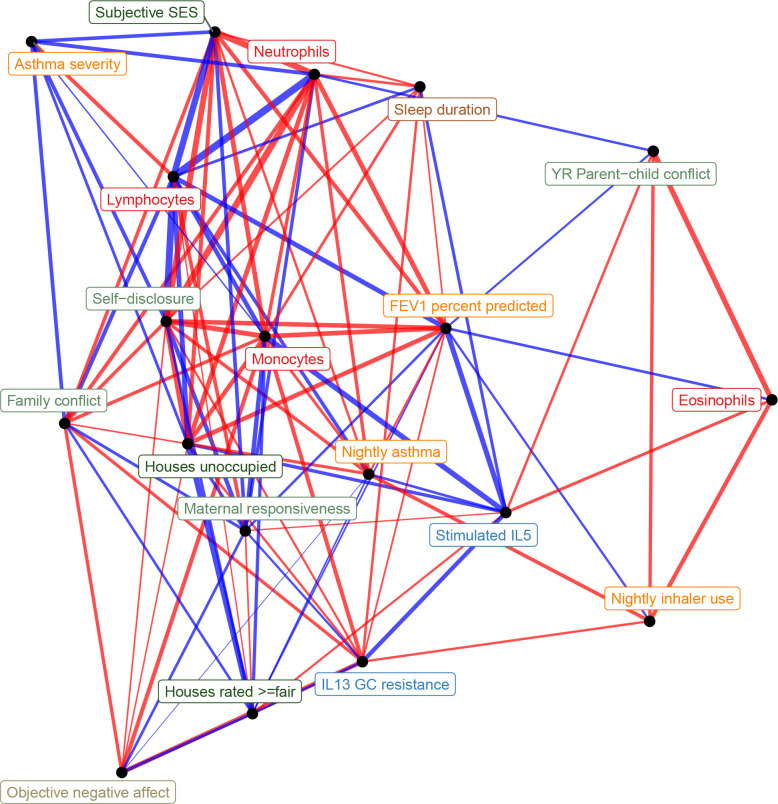
Figure 2—figure supplement 2. Network representation of correlations between all transcriptional signatures (edge width reflects absolute value of Pearson's correlation score, edge color reflects positive [red] or negative [blue] correlation).

Figure 2—figure supplement 2.