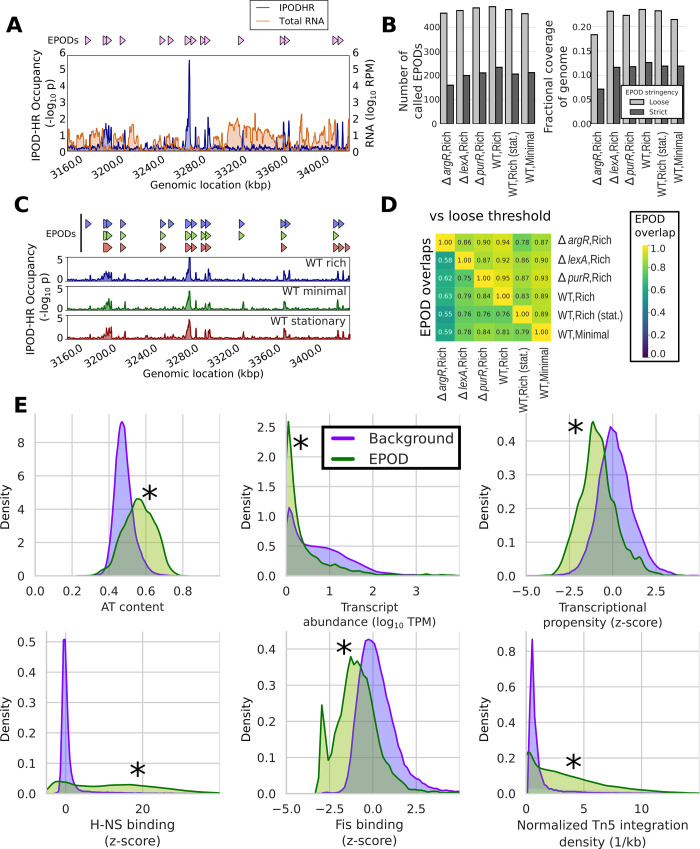
Fig 6. EPODs define stable genomic structures and are associated with many distinct features.
(A) EPOD calls from a representative genomic region in the WT rich media condition, along with protein occupancy and RNA levels smoothed with a 1-kb rolling median. All displayed/analyzed EPOD calls refer to our strict threshold unless otherwise noted. (B) Number of called EPODs by condition (left) and fraction of the genome covered by EPODs (right) for both our loose and strict thresholds (see text for details). (C) IPOD-HR occupancies (shown over a 1-kb rolling median) and associated EPOD calls under 3 different conditions, in the same genomic region shown in panel A. EPOD calls are shown above the occupancy, in the same order as the data tracks. (D) Lower triangle: Overlap of EPOD calls (using a symmetrized distance that is the average of the fraction of EPOD positions from a condition a that is also called in condition b and vice versa) between each pair (a,b) of the studied conditions. Upper triangle: Each entry shows the fraction of the EPOD calls (at a 5-bp resolution) from the sample defining that row that is contained in a relaxed set of EPOD calls (see text) of the sample defining that column (only the upper triangle of that matrix is shown; the lower triangle is similar except that the smaller ΔargR EPOD set contains fewer of the EPODs from other conditions). (E) Density plots showing normalized histograms (smoothed by a kernel density estimator) of the specified quantities for regions of the genome that are in EPODs vs. those that are not (Background), as assessed in the WT M9/RDM/glu (WT,rich) condition. “*” indicates FDR-corrected p < 0.005 via a permutation test (against a null hypothesis of no difference in medians). Significance calling and additional comparisons are shown in S4 Table. EPOD, extended protein occupancy domain; IPOD-HR, in vivo protein occupancy display—high resolution; WT, wild-type.

