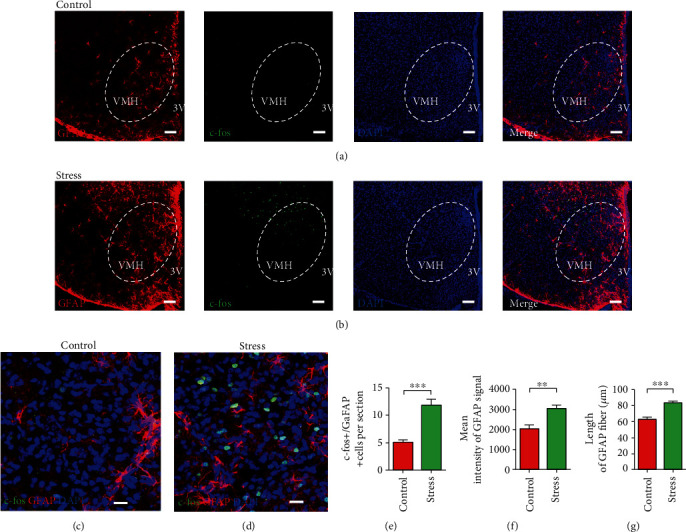
Figure 2.

Astrocytes in VMH are activated in chronic stress-treated mice. (a) Representative low magnification image showing triple staining of GFAP (red), c-fos (green), and DAPI (blue) in VMH of control group; scale bar, 100 μm. (b) Representative low magnification image showing triple staining of GFAP (red), c-fos (green), and DAPI (blue) in VMH of stress group; scale bar, 100 μm. (c) Representative high magnification image showing triple staining of GFAP (red), c-fos (green), and DAPI (blue) in VMH of control group; scale bar, 20 μm. (d) Representative high magnification image showing triple staining of GFAP (red), c-fos (green), and DAPI (blue) in VMH of stress group; scale bar, 20 μm. (e) Quantification of c-fos+ and GFAP+ coexpressed cells in control and stress groups; values represent mean ± SD (n = 20 sections from 5 mice per group; ∗∗∗p < 0.001; unpaired t-test). (f) Mean signal intensities of GFAP staining in VMH of control and stress groups; values represent mean ± SD (n = 5 mice per group; ∗∗p < 0.01; unpaired t-test). (g) The length of GFAP fiber in VMH astrocytes of control and stress groups; values represent mean ± SD (n = 20 cells; 4 cells from each mouse, 5 mice per group; ∗∗∗p < 0.001; unpaired t-test).
